Chart AI: Pattern Reader
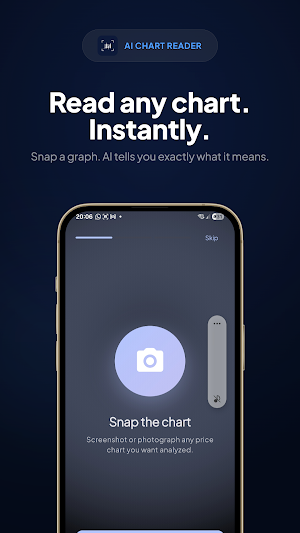
Screenshot a price chart to have its patterns named and explained
About Chart AI: Pattern Reader
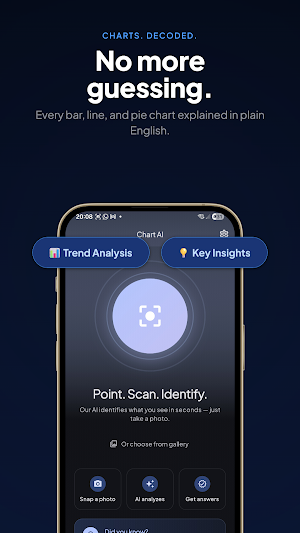
Chart analysis and candlestick pattern reader, for learning. Screenshot any price chart to see what is on it explained.
LEARN CHART PATTERNS
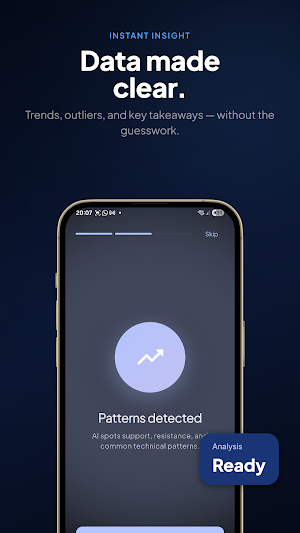
This chart analysis app names the candlestick and chart formations visible in a screenshot and explains what each term means. It covers head and shoulders, double tops and bottoms, flags, pennants, triangles, doji, hammer and engulfing candles.
SUPPORT AND RESISTANCE
The app marks the price levels a chart has repeatedly reacted to, and explains what those levels describe: past behaviour, not a guarantee about future behaviour. Levels break routinely.
INDICATORS EXPLAINED
Moving averages, RSI, MACD, stochastic oscillators and volume are interpreted where they appear on the chart.
EDUCATIONAL, NOT ADVICE
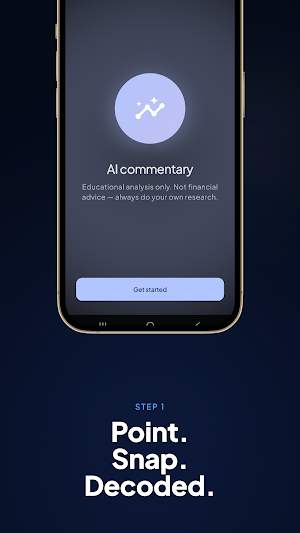
This app describes charts. It does not produce buy or sell signals, price targets or recommendations, and nothing it outputs is financial advice. Academic research broadly finds publicly known technical patterns have limited predictive power. Investment decisions carry real risk of loss and warrant a licensed adviser.
Works on equities, forex, crypto and commodities charts.
Similar Apps

Jewelry ID: Value & Gems
Identify jewellery from a photo: metal, hallmarks, stones and rough value

Bladder Diary: Voiding Log
Log toilet trips, leaks and fluids. Get the 3-day chart your clinic asks for.
Period Tracker & Cycle Diary
Log periods, symptoms and temperature. Get a report you can hand over.

IVF Log: Injection Tracker
Log injections, scans and blood results. Get a report for your clinic.
Gestational Diabetes Log
Log glucose readings, meals and insulin. Get a report for your midwife.
Menopause Tracker & HRT Log
Log hot flashes, symptoms and HRT doses. Get a report for your clinician.
