

Ashidori: Chart Indicators
GYOU GI Education iPhoneiPadiPod touch
Ashidori: Chart Indicators is a free Education app for iPhone and iPad by GYOU GI. Requires iOS 17.0. Updated September 4, 2026.
- Price
- Free
- on the App Store
- Size
- 2 MB
- Age 4+
- Updated
- Sep 4
- 2026 · v1.0
Screenshots


About Ashidori: Chart Indicators
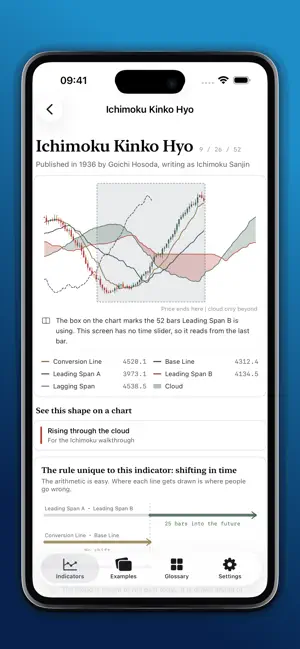
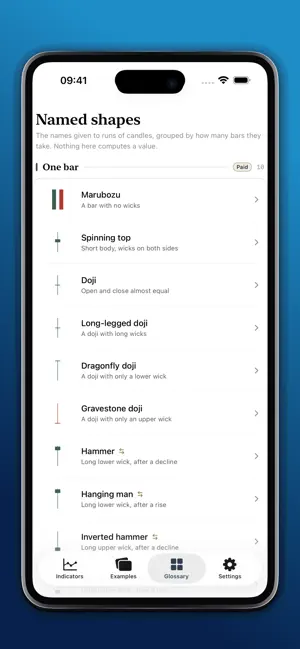
Ashidori is a study app about WHY a technical indicator produces the number it produces. It shows no quotes and no news. It gives no buy or sell judgements. Every price movement you see was authored by hand to explain that chapter. ■ Tap a term in the formula, and the line lights up Press EMA12 in "MACD = EMA12 − EMA26" and only EMA12 darkens on the chart. The other lines fade rather than disappear, so you can still compare shapes. A name in the formula and a line in the figure always carry the same spelling. ■ The bars being used are drawn as a moving frame Drag the time axis and a frame shows exactly which bars produced the value at that point. "A 25-day moving average uses 25 bars" becomes something you can count. For indicators that shift in time, such as Ichimoku, the figure shows which way and by how many bars. ■ Change the numbers and watch Lengths and coefficients are on sliders. Compare RSI at 9, 14 and 25. Turn Bollinger's ±2σ into ±1σ. Move CCI's 0.015. You find out which numbers are derived and which were simply agreed upon. Move one and the formula, the readouts and the calculation frame all follow. ■ Methods that grew up in Japan, a chapter each Ichimoku Kinko Hyo, the Sakata five methods, and Heikin-Ashi. Ichimoku gets a full screen for the part people get wrong most often: how the time shift works. ■ Where each indicator stops working Every chapter has one. Where a moving average says nothing in a flat range; where DMI can no longer name a direction. This is not a collection of the cases that worked. ■ Contents - 23 indicator chapters (basics / Japanese methods / oscillators / volume) - 20 named candlestick shapes (one-, two- and three-bar) - Worked examples: as many where the indicator fails as where it works - Japanese, English, Simplified Chinese, Traditional Chinese (switchable in-app) - Three-pane layout on iPad (contents / chart / formula and readings) ■ Price Four chapters are free in full: Candlesticks, Moving Average, MACD and Volume. Everything else opens with a single one-time purchase. It is not a subscription: no expiry, no auto-renewal, and there is no free-trial period. ■ What it does not do - No quotes, no order book, no news - No connection to any broker or exchange; it cannot place orders - No trading recommendations and no investment advice - No account, and no network requests of its own (other than the purchase) - No usage tracking Contact: [email protected]
App privacy
The developer, GYOU GI, reported these privacy practices to Apple.
Data Not Collected
The developer does not collect any data from this app.
Alternatives to Ashidori: Chart Indicators
Looking for apps like Ashidori: Chart Indicators? Here are 6 similar apps on the App Store. The highest rated is 缠习录 (5.0/5), and 5 of the 6 are free to download.


| App | Rating | Price | Last updated | Compare |
|---|---|---|---|---|
| Ashidori: Chart Indicators | – | Free | September 4, 2026 | |
| 喵酱日语 | – | Free | May 4, 2026 | Compare |
| Chart Dojo 100: Trading Drill | – | Free | Oct 16, 2026 | Compare |
| Kabuun: Learn Stocks Simply | – | Free | Sep 13, 2026 | Compare |
| Memo Clock | – | 6.99 USD | Oct 29, 2026 | Compare |
| 缠习录 | 5.0 / 5 (3) | Free | Oct 30, 2026 | Compare |
| 株けいこ 本物の株価で学ぶ株式投資 | – | Free | Oct 18, 2026 | Compare |