

LB Stock Finder
Matthew Szenher Finance iPhoneiPadiPod touch
LB Stock Finder is a free Finance app for iPhone and iPad by Matthew Szenher. Requires iOS 17.5. Updated November 27, 2024.
- Price
- Free
- on the App Store
- Size
- 9 MB
- Age 4+
- Updated
- Nov 27
- 2024 · v2.0
Screenshots

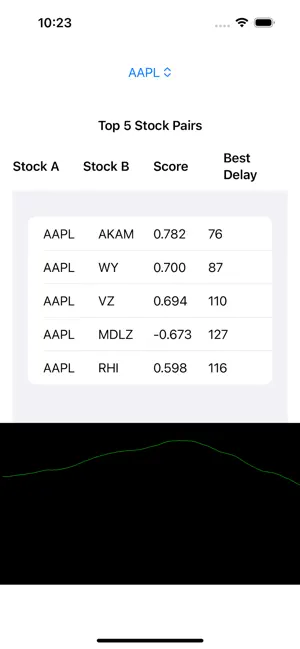
About LB Stock Finder
Introducing LB Stock Finder – your intelligent stock prediction companion! LB Stock Finder scans vast amounts of historical stock data to uncover patterns and correlations, helping you identify stocks that might influence each other. With advanced analysis, LB Stock Finder predicts offset timings, giving you insights into possible trends and market movements before they happen. Features: Correlation Analysis: Discover potential predictive relationships between stocks. Optimized Offsets: Pinpoint the time delay in days where one stock may impact another. Intuitive UI: A streamlined, easy-to-use interface designed for quick insights. Top Correlations: View the strongest correlations at a glance. Unlock new investment insights with StockFinder – because in today’s market, timing is everything! Double tap on the screen to pause the stock discovery process so you can take a screenshot of the results so far! You can have stocks randomly selected to compare with one another or choose a particular stock you wish to explore by using the "Choose a stock to explore" picker at the top. Note that this app only provides recommendations about which stocks might be correlated with some time delay. You should do your own due diligence and check this app's predictions with e.g. your favorite backtesting software before making any purchasing decisions. Here's a quick description of how to interpret what this app is telling you: Positive scores in the third column of the "Top 5 Stock Pairs" table are called correlations and can be interpreted as follows: if stock A moves in a certain direction today, then stock B will move in the same direction in the number of days indicated by "Best Delay". Negative scores are called anti-correlations and can be interpreted as follows: if stock A moves in a certain direction today, then stock B will move in the opposite direction in the number of days indicated by "Best Delay". If for example the app says that Stock A is PHM and Stock B is CE and that the best delay is 121 with a score of 0.815, then this means that the price change of PHM today strongly predicts what the price change of Stock B will be 121 days from now; the stronger the prediction, the closer the "Score" will be to 1.0 (and away from 0). If on the other hand the app says that Stock A is PEAK and Stock B is RSG and that the best delay is 30 with a score of -0.690, then this means that if PEAK goes up today then in 30 days the price of RSG is likely to go down; the stronger the prediction in this case, the closer the "score" will be to -1.0 (and away from 0).
What’s new
Version 2.0 · Updated November 27, 2024
New Marketing URL
App privacy
The developer, Matthew Szenher, reported these privacy practices to Apple.
Data Not Collected
The developer does not collect any data from this app.
Alternatives to LB Stock Finder
Looking for apps like LB Stock Finder? Here are 6 similar apps on the App Store. The highest rated is Oracle Investments (5.0/5), and all 6 are free to download.
-
 Oracle Investments
5.0
-
 Jckrbbt – AI Stock Scanner
5.0
-
 SIGNUM HQ: Stock Market AI
5.0
-
 Chart Echo
-
 PredictAlpha
5.0
-
 StockPriceAlerts: Stock Alerts
5.0
| App | Rating | Price | Last updated | Compare |
|---|---|---|---|---|
| LB Stock Finder | – | Free | November 27, 2024 | |
| Oracle Investments | 5.0 / 5 (2) | Free | Oct 2, 2026 | Compare |
| Jckrbbt – AI Stock Scanner | 5.0 / 5 (6) | Free | Sep 10, 2026 | Compare |
| SIGNUM HQ: Stock Market AI | 5.0 / 5 (2) | Free | Oct 12, 2026 | Compare |
| Chart Echo | – | Free | Oct 21, 2026 | Compare |
| PredictAlpha | 5.0 / 5 (1) | Free | Jun 15, 2026 | Compare |
| StockPriceAlerts: Stock Alerts | 5.0 / 5 (1) | Free | Sep 20, 2026 | Compare |
Compare LB Stock Finder with the top alternatives: ratings, updates, ASO score and keyword gaps →