

Stock Heatmap: Live Market Map
Stock Alarm, LLC Finance iPhoneiPadiPod touch
Stock Heatmap: Live Market Map is a free Finance app for iPhone and iPad by Stock Alarm, LLC. Rated 4.5/5 from 8 ratings. Requires iOS 18.5.
- Rating
- 4.5
- 8 ratings
- Price
- Free
- on the App Store
- Size
- 17 MB
- Age 4+
- Updated
- Oct 3
- 2026 · v1.5.1
Screenshots


About Stock Heatmap: Live Market Map
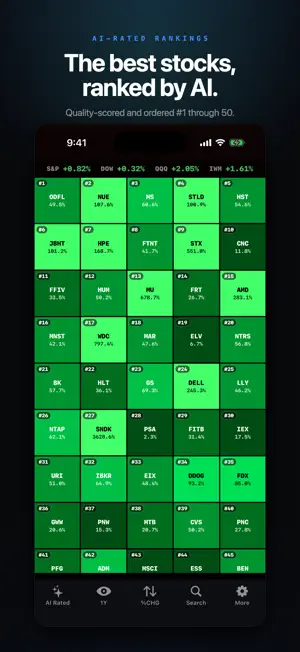
StockTouch turns the entire stock market into one live, color-coded heatmap. Watch all 500 S&P stocks move in real time — green for gainers, red for losers — and tap any tile for an instant quote, chart, and AI earnings summary. Backed by Stock Alarm — 300,000+ investors and a 4.8-star rating from 7,000+ reviews across the platform. It's the fastest way to see what's moving, where money is flowing, and which stocks are rated best — all at a glance. WHAT YOU CAN DO • Live S&P 500 heatmap — the whole market on one screen, updating in real time • Tap any stock for price, chart, key stats and an AI-written earnings summary • Sector heatmaps — instantly see which corners of the market are leading or lagging • Crypto heatmap — the top coins, color-coded and live • Movers — gainers, losers and most active in a single tap • AI Rated rankings — the best stocks scored 0–100 by a composite of momentum, fundamentals, breakout strength, volume and technicals • Watchlist — track the names you care about • Sort and color by anything — 1D to 1Y returns, market cap, revenue, P/E, dividend yield and more • Treemap or grid views, multiple color themes, pinch to zoom WHY STOCKTOUCH Most apps bury the market in endless lists and tickers. StockTouch shows you everything at once — a single picture you can read in seconds, then drill into with a tap. The built-in AI ratings help you spot quality names without spreadsheets. ONE SUBSCRIPTION, THE WHOLE ECOSYSTEM StockTouch Pro also unlocks the Stock Alarm app and pro.stockalarm.io — real-time price alerts, advanced screeners and deep research — all included and synced across your devices. One subscription, the entire Stock Alarm ecosystem. STOCKTOUCH PRO Unlock every scope, the AI Rated rankings, AI earnings summaries and premium themes — plus full access to the Stock Alarm app and pro.stockalarm.io. • Monthly — $19.99 / month • Annual — $167.99 / year (best value) Start with a free trial. Payment is charged to your Apple Account at confirmation of purchase. Your subscription automatically renews unless auto-renew is turned off at least 24 hours before the end of the current period. Your account is charged for renewal within 24 hours prior to the end of the current period. You can manage or cancel your subscription anytime in your Apple Account settings; any unused portion of a free trial is forfeited when you purchase a subscription. Terms of Use: https://stocktouch-web.vercel.app/terms Privacy Policy: https://stocktouch-web.vercel.app/privacy
Ratings & reviews
4.5
8 ratings
What’s new
Version 1.5.1 · Updated October 3, 2026
• Sorting now rearranges the map. Pick 1 Day, Volume, P/E or RSI and the board reorders — best first, top-left. Sort by a fundamental and every tile shows it. • New Spiral board: the classic center-out StockTouch layout. • New Show lenses: P/S, P/B and RSI heat. • Pinch to dive into a sector and back out, swipe between sectors, and a breadcrumb keeps you oriented. • Quote page: volume pane, 5-year chart, and a company profile card. • Long-press any tile for a quick peek — sparkline, key stats, open, alert or watch. • Index ticker now shows intraday sparklines. • Stability improvements.
App privacy
The developer, Stock Alarm, LLC, reported these privacy practices to Apple.
Data Not Collected
The developer does not collect any data from this app.
Alternatives to Stock Heatmap: Live Market Map
Looking for apps like Stock Heatmap: Live Market Map? Here are 6 similar apps on the App Store. The highest rated is HeatMap: Visual Stock Map (4.9/5), and all 6 are free to download.
-
 SectorView - US Stock Heatmap
4.8
-
 Stock+: Stock Market Heat Map
4.5
-
 HeatMap: Visual Stock Map
4.9
-
 Stock Map: S&P 500 Heatmap
4.8
-
 Realtime Stock Screener
4.7
-
 Finview: Stock Screener Signal
4.5
| App | Rating | Price | Last updated | Compare |
|---|---|---|---|---|
| Stock Heatmap: Live Market Map | 4.5 / 5 (8 ratings) | Free | October 3, 2026 | |
| SectorView - US Stock Heatmap | 4.8 / 5 (5) | Free | Oct 5, 2026 | Compare |
| Stock+: Stock Market Heat Map | 4.5 / 5 (80) | Free | Oct 23, 2026 | Compare |
| HeatMap: Visual Stock Map | 4.9 / 5 (226) | Free | Oct 15, 2026 | Compare |
| Stock Map: S&P 500 Heatmap | 4.8 / 5 (1,062) | Free | Sep 7, 2026 | Compare |
| Realtime Stock Screener | 4.7 / 5 (821) | Free | Sep 9, 2026 | Compare |
| Finview: Stock Screener Signal | 4.5 / 5 (4,416) | Free | Sep 16, 2026 | Compare |