

TickerTiles: Stock Dashboard
TickerTiles Finance iPhoneiPadiPod touch
TickerTiles: Stock Dashboard is a free Finance app for iPhone and iPad by TickerTiles. Rated 5.0/5 from 3 ratings. Requires iOS 17.5.
- Rating
- 5.0
- 3 ratings
- Price
- Free
- on the App Store
- Size
- 49 MB
- Age 12+
- Updated
- Oct 24
- 2026 · v1.1.14
Screenshots

About TickerTiles: Stock Dashboard
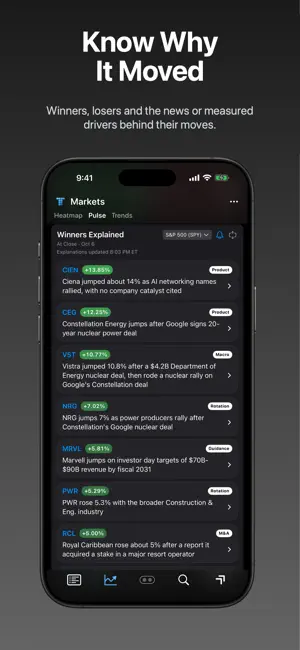
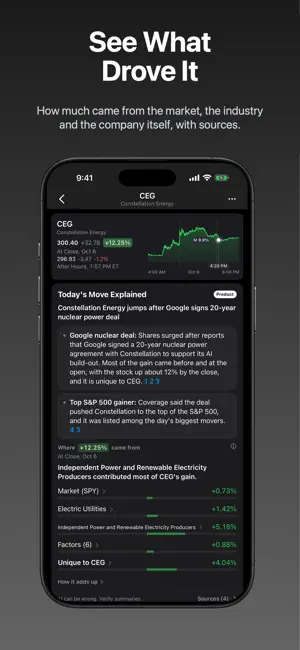
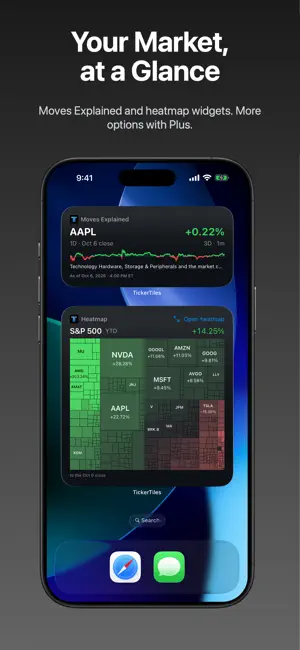
See what's moving. Understand why. TickerTiles brings stock market heatmaps, Moves Explained, watchlists and custom dashboards together on iPhone and iPad. Follow the market, explore a company's move and keep the stocks you care about close at hand. KNOW WHY A STOCK MOVED Moves Explained combines cited news with a breakdown of the market, industry and stock-specific parts of a move. Explore Winners Explained, Losers Explained or your own watchlist. Open a stock for today's explanation and past explained moves. When no qualifying news explanation is available, measured attribution provides context without inventing a catalyst. YOUR MARKET ON YOUR HOME SCREEN See a stock's return, chart and explanation, or scan the top winners, losers and watchlist movers with Moves Explained widgets. Add a large heatmap widget for a market-wide view. Tap a stock to explore it in the app, or open the whole heatmap. The S&P 500's 1D heatmap widget is free. Plus unlocks Moves Explained widgets and heatmap customization with other ETFs, watchlists and periods. Widgets show dated snapshots; iOS controls refresh timing. Moves Explained also offers Lock Screen widgets. ALERTS THAT BRING YOU BACK TO THE WHY Choose reminders for midday Moves Explained, the market close and key economic releases: jobs, inflation and Fed decisions. A closing reminder can open your watchlist's Moves Explained view. Manage categories in More > Alerts or turn them off in iOS Settings. Notification permission is required. SEE THE WHOLE MARKET Markets opens on a real-time S&P 500 heatmap. Tap a company, zoom in, or explore different return periods. With Plus, customize maps for other ETFs and your watchlists, and group them by sector or industry. Pulse brings together Top Movers, market breadth and explanations; Trends helps you explore performance across time. BUILD YOUR OWN DASHBOARDS Arrange charts, tables, sparklines, heatmaps and other tiles around the questions you follow. Connect watchlists to your tiles and swipe between Markets and your dashboards. Compare a company with its peers and explore intraday or historical performance. START WITH YOUR STOCKS Pick the names you follow to create your first watchlist. Discover new features in What's New, and revisit past releases from More whenever you want. COVERAGE 10,000+ U.S. stocks and ETFs, intraday prices, premarket and after-hours support, and 20+ years of price history where available. TICKERTILES PLUS An optional subscription unlocks unlimited dashboards and tiles, the full tile library, advanced settings, detailed Moves Explained, company peers, Moves Explained widgets and heatmap customization. Start with the free features and upgrade in the app. TickerTiles is for informational and research purposes only. It is not a brokerage, trading platform or source of investment advice. Market data and AI-assisted summaries may be delayed, incomplete or inaccurate. Verify important information before making decisions. Terms of Use (EULA): https://tickertiles.com/privacy-terms/ Privacy Policy: https://tickertiles.com/privacy-terms/
What’s new
Version 1.1.14 · Updated October 24, 2026
Inside the ETF. • ETF Movers joins Markets › Trends: see the top five and bottom five holdings in each ETF. Start with 3M, or change the period to find a new set of leaders and laggards. • Explore SPY for free across every period. Plus opens more ETF sets, a customizable lineup of up to 24 funds, and table view. • Moves Explained widgets now show the day's real movers to everyone; Plus adds why they moved. • New to Plus? Your first week is free. Cancel anytime in the App Store.
App privacy
The developer, TickerTiles, reported these privacy practices to Apple.
Data Linked to You
The following data, which may be collected and linked to your identity, may be used for the following purposes:
- Purchases: Purchase History
- Identifiers: User ID, Device ID
- Usage Data: Product Interaction, Advertising Data, Other Usage Data
- Diagnostics: Crash Data, Performance Data, Other Diagnostic Data
- Contact Info: Email Address, Name
- User Content: Photos or Videos, Customer Support, Other User Content
Used for: Analytics, App Functionality
Alternatives to TickerTiles: Stock Dashboard
Looking for apps like TickerTiles: Stock Dashboard? Here are 6 similar apps on the App Store. The highest rated is StockFloc: Stock Watchlist (5.0/5), and all 6 are free to download.
-
 StockFloc: Stock Watchlist
5.0
-
 ChartMind - AI Stock Analysis
-
 Gold Insight: Market Analyst
-
 TLDR Markets
5.0
-
 Oil Whisperer Compass
-
 Nassau St
| App | Rating | Price | Last updated | Compare |
|---|---|---|---|---|
| TickerTiles: Stock Dashboard | 5.0 / 5 (3 ratings) | Free | October 24, 2026 | |
| StockFloc: Stock Watchlist | 5.0 / 5 (2) | Free | Sep 25, 2026 | Compare |
| ChartMind - AI Stock Analysis | – | Free | May 3, 2026 | Compare |
| Gold Insight: Market Analyst | – | Free | Sep 30, 2026 | Compare |
| TLDR Markets | 5.0 / 5 (2) | Free | Feb 19, 2026 | Compare |
| Oil Whisperer Compass | – | Free | Mar 26, 2026 | Compare |
| Nassau St | – | Free | May 4, 2026 | Compare |