

Stock Charts & Signal: MA
乃 樊 Finance iPhoneiPadiPod touch
Stock Charts & Signal: MA is a paid Finance app for iPhone and iPad by 乃 樊. Requires iOS 17.0. Updated June 6, 2026.
- Price
- 3.99 USD
- on the App Store
- Size
- 6 MB
- Age 17+
- Updated
- Jun 6
- 2026 · v8.60
Screenshots


About Stock Charts & Signal: MA
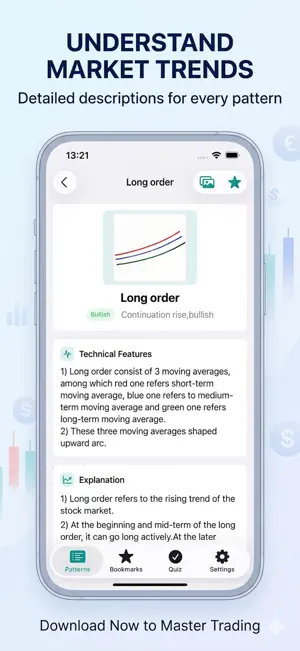
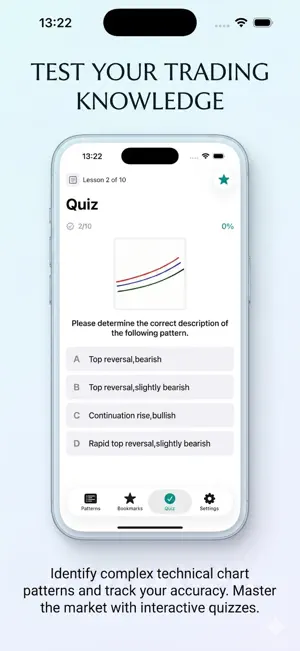
This app is your guide to mastering Moving Averages (MA) in the stock market. And MA stands for Moving Average. The app is designed to demystify the technique of moving average analysis in the stock market. It is tailored for traders of all levels, from day traders to seasoned investors, aiming to provide a comprehensive understanding of moving averages and their crucial role in technical analysis. Moving averages is the best partner for candlestick charts. Moving averages smooth price data, offering a clear view of the market's trend, while candlestick charts capture the ebb and flow of market sentiment, providing insights into potential trend reversals and continuations. This perfect pairing allows traders to monitor the momentum of stocks and forecast future price movements with greater accuracy. The app pairs the simplicity of moving averages with the visual richness of candlestick charts, creating a dynamic duo that enhances any trader's toolkit. The app transforms complex financial data into actionable strategies, making it easier for traders to identify entry and exit points in their day trading or long-term investing. With it, users can expect a robust platform in their mind that not only monitors market trends but also alerts them to significant patterns and quotes. This software serves as a personal finance study and research assistant, providing the tools necessary to build a diverse and profitable portfolio. Whether you're a novice looking for a solid foundation in moving average strategies or an experienced trader seeking to refine your techniques, this app is your go-to app for navigating the intricacies of the stock market. In conclusion, this app is more than just an app; it's a comprehensive guide to mastering the moving average technique in stock market trading. It is a hub for real-time quotes and financial insights, where every chart and signal are designed to help users invest wisely. It provides traders with a powerful tool for predicting market movements and making informed investment decisions. With this app at your fingertips, you'll be well-equipped to track and capitalize on the ever-changing trends of the stock market. Welcome to download and use our app. We look forward to your feedback. Furthermore, the main features and meanings of each basic form are described in detail. This software is also very suitable for the junior investors. Specific content includes: 1. The classic patterns and forms of moving average system 2.Definition,recognition and explanation of every pattern and signal 3.Exercises training and statistical functions 4.Bookmark function
What’s new
Version 8.60 · Updated June 6, 2026
- Updated interface and navigation - Improved pattern list, detail pages, and multi-example viewing - Refined search, bookmarks, and quiz flow - Added multiple visual themes - Updated compatibility details
App privacy
The developer, 乃 樊, reported these privacy practices to Apple.
Data Not Collected
The developer does not collect any data from this app.
Alternatives to Stock Charts & Signal: MA
Looking for apps like Stock Charts & Signal: MA? Here are 6 similar apps on the App Store. The highest rated is Caveo (5.0/5), and 4 of the 6 are free to download.


| App | Rating | Price | Last updated | Compare |
|---|---|---|---|---|
| Stock Charts & Signal: MA | – | 3.99 USD | June 6, 2026 | |
| FinIQ | – | 1.99 USD | Dec 14, 2023 | Compare |
| Kimi Signals | – | Free | Apr 13, 2026 | Compare |
| Capital Markets Brokers | 1.0 / 5 (1) | Free | Mar 30, 2025 | Compare |
| Caveo | 5.0 / 5 (2) | Free | Dec 16, 2025 | Compare |
| Bitcoin Convert | 4.7 / 5 (511) | 1.99 USD | Oct 20, 2025 | Compare |
| EPIQ Trading Floor | 5.0 / 5 (5) | Free | Oct 6, 2026 | Compare |