

Boxplot
Education Contains ads
Box-and-whisker plots: five-number summary, IQR & outliers. Works offline.
- Downloads
- 36+
- on Google Play
- Price
- Free
- No in-app purchases
- Updated
- Sep 13
- 2026 · v1.3
Screenshots


About Boxplot
Boxplot — the fastest way to compare several distributions on one simple chart.
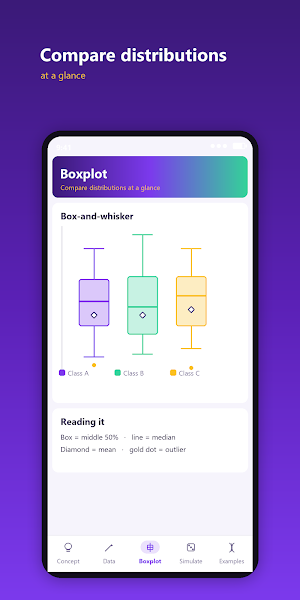
A box-and-whisker plot squeezes a whole dataset into one neat shape: a box for the middle half of the data, a line for the median, whiskers reaching out to the rest, and separate dots for any outliers. Line a few up side by side and, in a single glance, you can see which group is highest, which is most consistent, and which hides surprises. Perfect for students, teachers and anyone who works with data.
Boxplot does it all offline, with no clutter and a clean, modern design.
WHAT YOU CAN DO
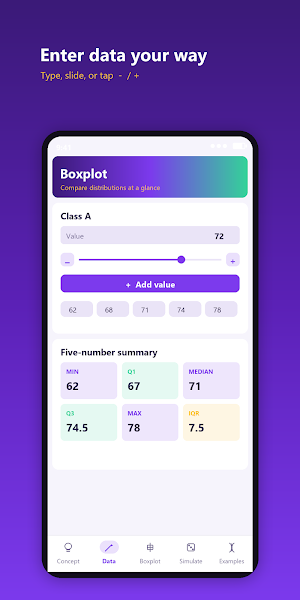
• Enter data your way — type a number, drag the slider, or tap the – / + steppers. Build up to four named groups with live thousand separators.
• See the five-number summary instantly — minimum, Q1, median, Q3 and maximum, plus the IQR and the mean for every group.
• Read the signature chart — side-by-side vertical box-and-whisker plots on a shared axis, with median lines, hollow mean diamonds and gold outlier dots.
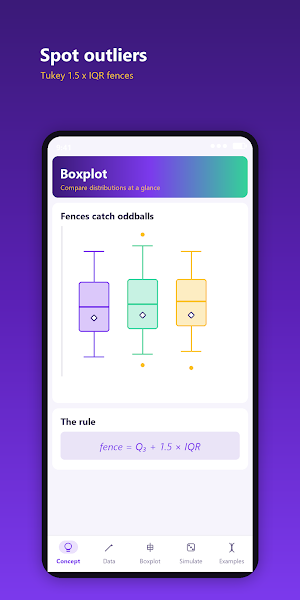
• Catch outliers automatically — Tukey's 1.5 × IQR fences flag the oddballs for you.
• Simulate and explore — generate groups that differ in centre, spread, or number of outliers, and watch the boxes shift, stretch and sprout dots.
• Load ready-made examples — exam scores by class, plant growth by fertilizer, reaction times before and after coffee — each one opens straight into the editor.
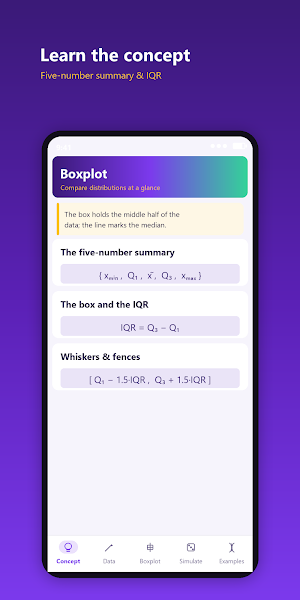
• Learn the concept — clear, friendly explanations of the five-number summary, the box and the IQR, whiskers and fences, and how to read skew. Mathematical formulas are rendered beautifully and fully offline.
WHY YOU'LL LIKE IT
• Works fully offline — no account, no internet needed.
• Tiny and fast — the charts are drawn natively, with no heavy chart libraries, so the app stays light.
• Clean "Violet Mint" design — easy on the eyes, with a distinct colour for each group.
• Built for learning — designed to make statistics click, whether you're in class or revising for an exam.
UNDERSTAND YOUR DATA
The five-number summary: { min, Q1, median, Q3, max }
The inter-quartile range: IQR = Q3 − Q1
Tukey fences: [ Q1 − 1.5 × IQR , Q3 + 1.5 × IQR ]
A tall box means a spread-out group; a short box means a tight one. If the median sits in the middle and the whiskers match, the data is symmetric; if one whisker is longer, the data is skewed that way. Compare the mean diamond with the median to spot skew at a glance.
Whether you're comparing classes, machines, treatments or experiments, Boxplot turns rows of numbers into a picture you can actually read.
Download Boxplot and start comparing distributions at a glance.
What’s new
Version 1.3 · Updated September 13, 2026
improve app performance
Alternatives to Boxplot
Looking for apps like Boxplot? Here are 6 similar Android apps on Google Play. The highest rated is SoulKu (4.8/5), and all 6 are free to download.






| App | Rating | Price | Installs | Last updated | Compare |
|---|---|---|---|---|---|
| Boxplot | – | Free | 10+ | Sep 13, 2026 | |
| Vantix Law | 4.6 / 5 | Free | 5,000+ | Oct 1, 2026 | Compare |
| Blue Sky Vitamin | 4.8 / 5 | Free | 1,000+ | Oct 8, 2026 | Compare |
| Lifeboost Coffee | 4.8 / 5 | Free | 10,000+ | Sep 17, 2026 | Compare |
| Keurig | 4.5 / 5 | Free | 100,000+ | Jul 29, 2026 | Compare |
| HydroJug | 4.8 / 5 | Free | 10,000+ | Oct 15, 2026 | Compare |
| SoulKu | 4.8 / 5 | Free | 1,000+ | Oct 15, 2026 | Compare |
Compare Boxplot with the top alternatives: ratings, updates, ASO score and keyword gaps →