

Bland-Altman
Education Contains ads
Bland-Altman plots & limits of agreement - method comparison, fully offline.
- Downloads
- 5+
- on Google Play
- Price
- Free
- No in-app purchases
- Updated
- Oct 7
- 2026 · v1.4
Screenshots
Save to Pinterest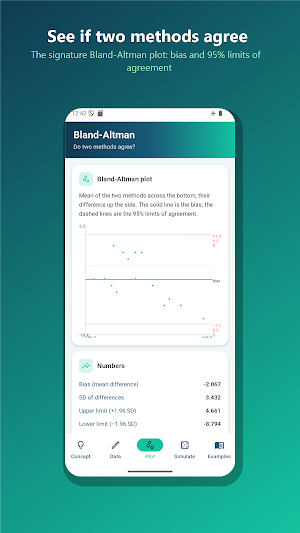

About Bland-Altman
Do two measurement methods agree well enough to use one in place of the other? A correlation will not tell you - but a Bland-Altman plot will. This app builds that plot for you and reports every number that goes with it, all on your device and fully offline.
Enter your paired measurements (Method A and Method B), and instantly see the bias, the 95% limits of agreement, how many points fall inside them, the confidence interval for the bias, and the slope that flags proportional bias. Then look at the signature chart: the average of each pair across the bottom, the difference up the side, a solid bias line and dashed limit-of-agreement lines.
WHAT YOU CAN DO
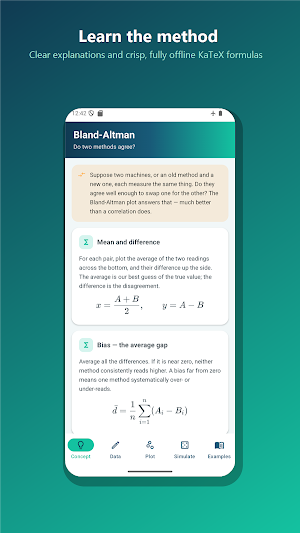
- Concept: a clear, plain-language explanation of mean vs difference, bias, the 95% limits of agreement, proportional bias, and why agreement is not the same as correlation - with crisp, fully offline math formulas.
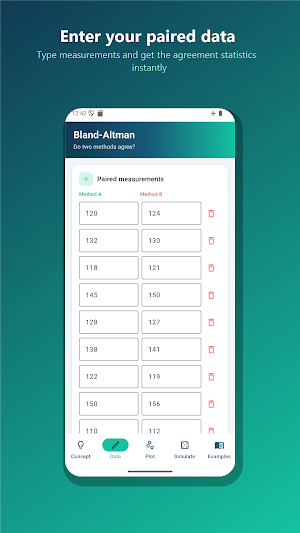
- Data: type paired measurements with live thousand separators. Numbers can be typed by hand. See the agreement statistics update as you go.
- Plot: the classic Bland-Altman scatter with the bias line, the +/- 1.96 SD limits of agreement and a zero-difference reference.
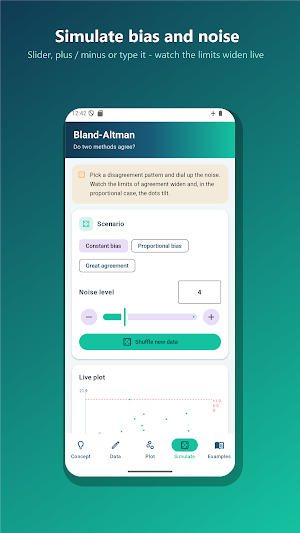
- Simulate: choose constant bias, proportional bias or great agreement, then set the noise level with a slider, the plus / minus buttons, or by typing the value. Watch the limits of agreement widen and the cloud of points tilt in real time.
- Examples: ready-made method comparisons - two blood-pressure monitors, two kitchen scales, two lab assays - that you can load into the Data tab and explore.
WHAT IT REPORTS
- Bias (mean difference, Method A minus Method B)
- Standard deviation of the differences
- Upper and lower limits of agreement (bias +/- 1.96 SD)
- Percentage of points within the limits
- 95% confidence interval for the bias
- Proportional-bias slope of difference against mean
- Number of pairs
WHY THIS APP
- 100% offline - your data never leaves your phone and no account is needed.
- Built for students, researchers, lab and clinical staff, engineers and anyone comparing two ways of measuring the same thing.
- Clean, distraction-free design with a clinical feel.
- Lightweight and fast, with no external chart libraries.
A NOTE ON USE
This app is an educational and analysis tool for method-comparison statistics. It is not a medical device and does not provide medical advice or diagnosis. Whether a given level of agreement is acceptable is a practical or clinical decision, not a statistical one.
Build your Bland-Altman plot in seconds and see, at a glance, whether two methods really agree.
Enter your paired measurements (Method A and Method B), and instantly see the bias, the 95% limits of agreement, how many points fall inside them, the confidence interval for the bias, and the slope that flags proportional bias. Then look at the signature chart: the average of each pair across the bottom, the difference up the side, a solid bias line and dashed limit-of-agreement lines.
WHAT YOU CAN DO
- Concept: a clear, plain-language explanation of mean vs difference, bias, the 95% limits of agreement, proportional bias, and why agreement is not the same as correlation - with crisp, fully offline math formulas.
- Data: type paired measurements with live thousand separators. Numbers can be typed by hand. See the agreement statistics update as you go.
- Plot: the classic Bland-Altman scatter with the bias line, the +/- 1.96 SD limits of agreement and a zero-difference reference.
- Simulate: choose constant bias, proportional bias or great agreement, then set the noise level with a slider, the plus / minus buttons, or by typing the value. Watch the limits of agreement widen and the cloud of points tilt in real time.
- Examples: ready-made method comparisons - two blood-pressure monitors, two kitchen scales, two lab assays - that you can load into the Data tab and explore.
WHAT IT REPORTS
- Bias (mean difference, Method A minus Method B)
- Standard deviation of the differences
- Upper and lower limits of agreement (bias +/- 1.96 SD)
- Percentage of points within the limits
- 95% confidence interval for the bias
- Proportional-bias slope of difference against mean
- Number of pairs
WHY THIS APP
- 100% offline - your data never leaves your phone and no account is needed.
- Built for students, researchers, lab and clinical staff, engineers and anyone comparing two ways of measuring the same thing.
- Clean, distraction-free design with a clinical feel.
- Lightweight and fast, with no external chart libraries.
A NOTE ON USE
This app is an educational and analysis tool for method-comparison statistics. It is not a medical device and does not provide medical advice or diagnosis. Whether a given level of agreement is acceptable is a practical or clinical decision, not a statistical one.
Build your Bland-Altman plot in seconds and see, at a glance, whether two methods really agree.
What’s new
Version 1.4 · Updated October 7, 2026
improve app performance
Alternatives to Bland-Altman
Looking for apps like Bland-Altman? Here are 6 similar Android apps on Google Play. All of them are free to download.
-
Stair Calculator
-
Rebar Calculator
-
Gross Profit Calculator
-
Amortization Calculator
-
Roofing Calculator
-
PEG Ratio Calculator
| App | Rating | Price | Installs | Last updated | Compare |
|---|---|---|---|---|---|
| Bland-Altman | – | Free | 5+ | Oct 7, 2026 | |
| Stair Calculator | – | Free | 100+ | Oct 3, 2026 | Compare |
| Rebar Calculator | – | Free | 100+ | Sep 28, 2026 | Compare |
| Gross Profit Calculator | – | Free | 100+ | – | Compare |
| Amortization Calculator | – | Free | 1,000+ | – | Compare |
| Roofing Calculator | – | Free | 100+ | Oct 1, 2026 | Compare |
| PEG Ratio Calculator | – | Free | 100+ | Sep 23, 2026 | Compare |
Compare Bland-Altman with the top alternatives: ratings, updates, ASO score and keyword gaps →