

Deja - Chart Pattern Analysis
formerry Finance Contains ads
Find similar historical chart patterns and predict price moves with statistics.
- Downloads
- 10+
- on Google Play
- Price
- Free
- No in-app purchases
- Updated
- May 17
- 2026 · v1.0.3
Screenshots
About Deja - Chart Pattern Analysis
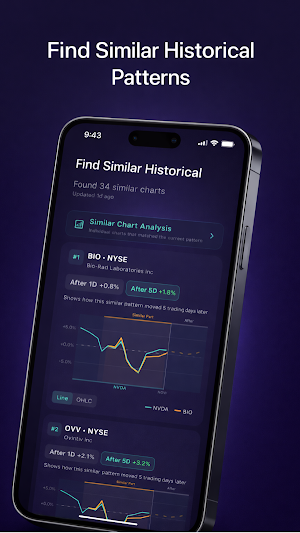
Have you ever looked at a stock chart and thought, "I have seen this pattern before"? Deja finds historical charts that match your current pattern and shows you what happened next.
Deja scans thousands of historical price patterns across stocks and crypto to find the ones most similar to the chart you are looking at right now. Then it tells you, with real statistics, how those similar patterns played out -- whether prices went up or down, and by how much.
CORE FEATURES
-- Pattern Matching Engine
Deja identifies similar historical chart patterns across NASDAQ, NYSE, and crypto markets. Each match includes a similarity score so you know how closely it resembles the current chart.
-- Statistical Predictions
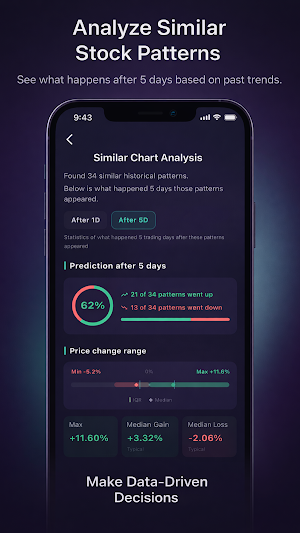
For each set of matched patterns, Deja calculates 1-day and 5-day predictions including win rate, maximum gain, maximum loss, IQR range, and median outcomes. No guesswork -- just data.
-- Interactive Comparison Charts
Overlay the current chart with any historical match to visually compare how patterns align. Switch between line and OHLC views. See exactly where the "similar part" is and what happened after.
-- Customizable TP/SL Levels
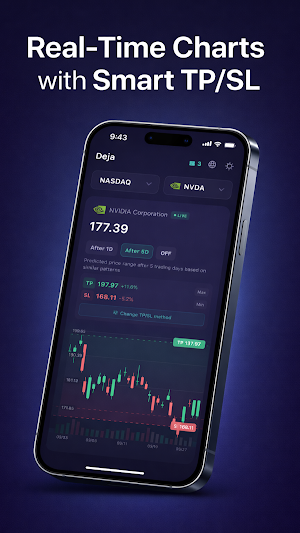
Set your Take Profit and Stop Loss using the metric that fits your trading style -- Max, Min, IQR bounds, or Median values. The chart updates in real time to show your selected levels.
-- Live Price Data
Real-time price updates via WebSocket with historical data merged seamlessly. Watch the current pattern develop as it happens.
-- Multi-Market Coverage
Browse and analyze charts from NASDAQ, NYSE, NYSE-ARCA, and major cryptocurrency pairs.
HOW TO USE
1. Select a market category and symbol
2. View the live candlestick chart with prediction overlays
3. Scroll down to see the full statistical analysis
4. Explore individual similar chart matches
5. Use the data to inform your trading decisions
Deja does not predict the future. It shows you what historically happened when similar patterns appeared. Use this information as one input in your trading analysis.
Download Deja and start making data-driven trading decisions.
What’s new
Version 1.0.3 · Updated May 17, 2026
Bug Fix
Alternatives to Deja - Chart Pattern Analysis
Looking for apps like Deja - Chart Pattern Analysis? Here are 6 similar Android apps on Google Play. All of them are free to download.
-
CRYPTOAI - Crypto AI
-
Color Mixing
-
Hilo - Blackjack Card Counter
-
Corrly - Asset Correlation
-
ChartMind - AI Stock Analysis
-
Fundex - Stock & Crypto Data
| App | Rating | Price | Installs | Last updated | Compare |
|---|---|---|---|---|---|
| Deja - Chart Pattern Analysis | – | Free | 10+ | May 17, 2026 | |
| CRYPTOAI - Crypto AI | – | Free | 1,000+ | Sep 18, 2024 | Compare |
| Color Mixing | – | Free | 1,000+ | Jan 4, 2026 | Compare |
| Hilo - Blackjack Card Counter | – | Free | 50+ | – | Compare |
| Corrly - Asset Correlation | – | Free | 10+ | – | Compare |
| ChartMind - AI Stock Analysis | – | Free | 10+ | May 3, 2026 | Compare |
| Fundex - Stock & Crypto Data | – | Free | 10+ | – | Compare |
Similar apps on Google Play
- CRYPTOAI - Crypto AI
- Color Mixing
- Hilo - Blackjack Card Counter
- Corrly - Asset Correlation
- ChartMind - AI Stock Analysis
- Fundex - Stock & Crypto Data
- Fintell - Stock News Sentiment
- CapRank - Market Cap Rankings
- Bulliq - Stock Chart Quiz Game
- SectorFlow - Hot&Cold Sectors
- MindBloom - AI Meditation
- Foodketlist - Food Bucketlist
- Uncertain - AI Market Insight
- BullBear - Stock & Bitcoin
- Chart Quiz - Stock & Crypto
- Ideabot – Easy planning AI
- Body Ratio AI
- Face Ratio Score Analyzer
- FearGreed Stats
- NoteQuiz
- FaceCrop Auto
- TrendGlobe
- Pinocchio AI
- 피노키오AI
- 한국 미신
- Superstition USA
- Color Maker Lab
- LiveMap
- NYSE Chart AI
- NASDAQ Chart AI
- Crypto Chart AI
- If Invest
- TimeSync - World
- ForexRate
- CEO Path
- Save Link
- UltraStop - StopWatch
- Dream Interpretation
- NYSEAI - NYSE AI
- Buddhist Repentance
- Repent
- Confession
- Perfect Pitch
- Encryptify
- NASDAQAI - Nasdaq AI
- Eat Suppressor