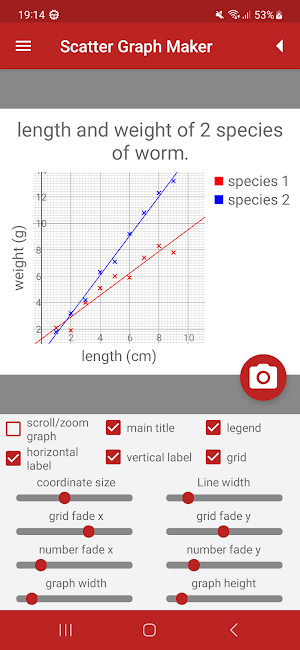


Easily create Scatter graphs for use in reports, projects and assignments.


• Easy to use interface.
• Save scatter graphs to the phone's memory to use in your own work.
• Up to 1000 data points in each data set with up to 10 data sets displayed simultaneously on each graph.
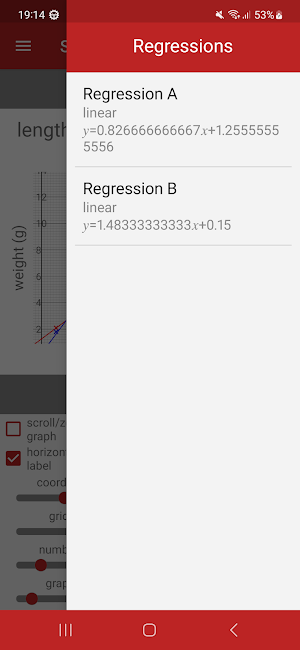
• Add regression lines to the graph: linear, quadratic, cubic, polynomial (up to degree 10), logarithmic, power, exponential, sine, logistic, median-median or connect with straight lines from point to point.
• Optional chart legend, or add labels directly to the scatter graph.
• Paste values from the data editor directly to the scatter graph sheet.
• All colors are fully customizable.
This free scientific calculator offers a number of useful features allowing you...
• Easy to use interface.• Save line graphs to the image gallery...
• Easy to use interface.• Save pie charts to the image gallery...
• Easy to use interface.• Save bar charts to the image gallery...
• Easy to use interface.• Save scatter graphs to the phone's memory...
• Easy to use interface allows the calculation of percentage changes.• Calculate...
Created with AppPage.net
Similar Apps - visible in preview.