

Calculate Fibonacci Sequence, retracements and expansions for technical analysis


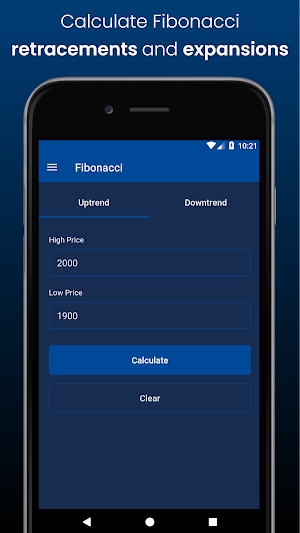
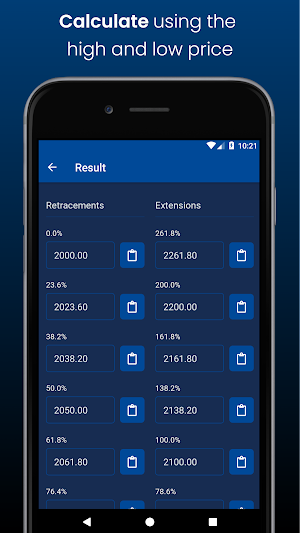
The Fibonacci Calculator will calculate Fibonacci retracements and expansions based on two values (high and low). The available Fibonacci retracements include: 23.6%, 38.2%, 50%, 61.8%, 76.4%, 100%, 138.2%. Additionally, the following expansions are available: 261.8%, 200%, 161.8%, 138.2%, 100%, 61.8%.
Key Features:
- Calculate using the high and low of the asset;
- Fibonacci Sequence;
- Fibonacci Calculator;
- Fibonacci retracements: 23.6%, 38.2%, 50%, 61.8%, 76.4%, 100%, 138.2%;
- Fibonacci expansions: 261.8%, 200%, 161.8%, 138.2%, 100%, 61.8%.
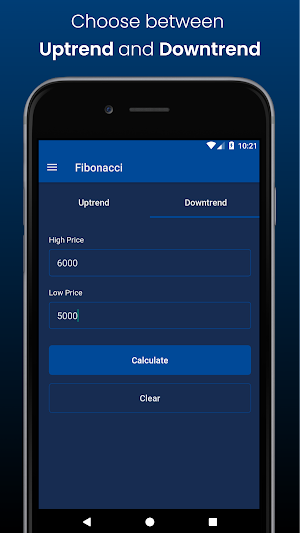
- Calculate Uptrend;
- Calculate Downtrend;
- Support and Resistance;
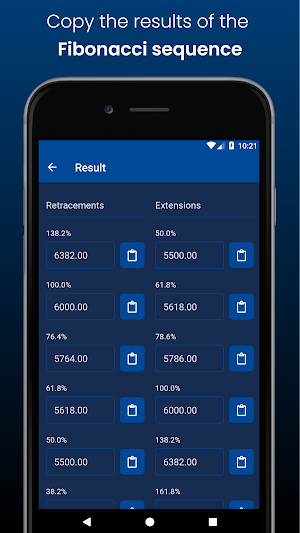
- Copy and paste prices.
What is the Fibonacci Sequence?
The Fibonacci sequence is an infinite mathematical series where each number is the sum of the two preceding ones, starting with 0 and 1. Formally, the sequence begins with 0, 1, and then the next numbers are 1, 2, 3, 5, 8, 13, and so on. In addition to its fascinating mathematical properties, the Fibonacci sequence is often observed in nature, in phenomena such as the arrangement of petals in flowers and the structure of shells and galaxies, adding an aesthetic and intriguing element to its mathematical significance.
The Fibonacci tool is used in various assets and financial markets for technical analysis. In addition to cryptocurrencies like Bitcoin and traditional currencies like the dollar, it is applied to stock indices such as the S&P 500 and NASDAQ. Futures contracts, such as Winfut and Mini Index, often employ the Fibonacci sequence to identify support and resistance levels. In the commodities market, such as gold and oil, Fibonacci also plays a crucial role. Its versatility allows traders to gain valuable insights into a wide range of assets, facilitating informed decision-making.
How to apply Fibonacci retracement in an uptrend?
By using the minimum value as the starting point and the maximum as the endpoint, the calculated retracements will act as support levels, while the extensions will act as resistance levels.
How to apply Fibonacci retracement in a downtrend?
Reversing the approach, with the maximum as the starting point and the minimum as the endpoint, the calculated retracements will act as resistance levels, while the extensions will act as support levels.
In Day Trading, are Fibonacci retracements effective?
This tool can be applied in any trading period and style, whether short-term (scalping) or long-term (trend following). Its greatest relevance is observed in longer timeframes, such as 30 minutes or more, to minimize short-term market noise.
How to use Fibonacci in Forex trading?
Fibonacci levels in Forex trading, such as 23.6%, 38.2%, 61.8%, are crucial for identifying support and resistance. These references, derived from the natural sequence, are crucial for traders in predicting price turning points. For example, a 23.6% retracement on EURUSD to 1.0084 can be strategically used as support for buying decisions, as well as for setting stop loss or take profit levels.
Enhance your technical analysis in the financial market. Download the Fibonacci Calculator now to improve your trading performance!
The Discount Calculator is the essential tool for sellers and entrepreneurs looking...
Simulate your investments with the Dividend Calculator, the indispensable tool for calculating...
This betting calculation tool supports various betting odds formats, including fractional, decimal,...
The Fabric Calculator is the ideal application to assist craftsmen, seamstresses, tailors,...
The Average Price Calculator app provides an efficient solution for investors to...
Learn Roman numerals from 1 to 1000 with our exciting quiz! This...
Created with AppPage.net
Similar Apps - visible in preview.