
Expense Manager
In-app purchases
4.1star
28.5K reviews
1M+
Downloads

Rated for 3+
info

About this app
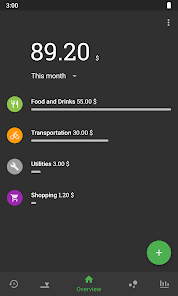
Manage your expenses directly on your smartphone. Easily keep track of your finances.
This app allows you to record your expenses easily. Optionally you can assign a category to your expense in order to get detailed statistics and helpful insights.
Features:
- Simple Design
- Ad-Free
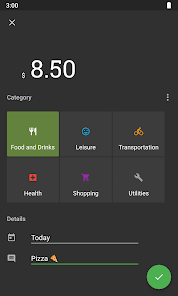
- Record expenses
- Assign categories
- Manage monthly overheads
- Manage categories
- Set a monthly limit
- Homescreen widget for even faster usage
- DashClock Integration
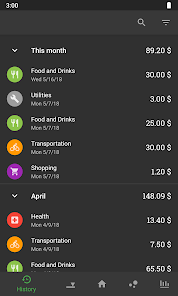
- Expense History
- Spreadsheet Export
- Group your expenses by week, month or year
- Backup/Restore Feature
- Record incomes (In-App purchase)
- Detailed Stats (In-App purchase)
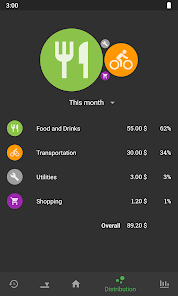
- Expense Distribution (In-App purchase)
Permissions
Network Communication:
Send feedback to the developer inside the app.
Error reports
Storage:
For CSV export
This app allows you to record your expenses easily. Optionally you can assign a category to your expense in order to get detailed statistics and helpful insights.
Features:
- Simple Design
- Ad-Free
- Record expenses
- Assign categories
- Manage monthly overheads
- Manage categories
- Set a monthly limit
- Homescreen widget for even faster usage
- DashClock Integration
- Expense History
- Spreadsheet Export
- Group your expenses by week, month or year
- Backup/Restore Feature
- Record incomes (In-App purchase)
- Detailed Stats (In-App purchase)
- Expense Distribution (In-App purchase)
Permissions
Network Communication:
Send feedback to the developer inside the app.
Error reports
Storage:
For CSV export
Updated on
Safety starts with understanding how developers collect and share your data. Data privacy and security practices may vary based on your use, region, and age. The developer provided this information and may update it over time.

No data shared with third parties
Learn more about how developers declare sharing

This app may collect these data types
App activity

Data is encrypted in transit
Ratings and reviews
4.1
27K reviews

Enio Linhares Jr
- Flag inappropriate
April 5, 2021
I've been using this app for the past 3 years. This app used to be excellent, however the last update has changed the way you visualize the distribution/statistics. The previous versions were much better. The new data visualization layout does not show the distribution in a clean statistical way. Using circular sectors to show data is one of the "no go" graphs in the data visualisation literature.
39 people found this review helpful

A Google user
- Flag inappropriate
- Show review history
September 20, 2019
I use this app since 2014. Has only basic reporting and analysis capabilities, but is so simple that I love it. You have categories, can set budget on them and track income and expenses. Has a calculator when adding expenses/income. UI is clear and simple. You can export data to Excel sheets, so you can create reports with that (which is very powerful). (I paid for income management, but the price was surely worth it).
53 people found this review helpful

Syed Muhammad Hashim
- Flag inappropriate
- Show review history
April 13, 2022
Easy and Simple to use. I upgraded to the paid version. In the Statistics, there should be an option to have the average expense for a specific number of days rather than the whole history. There are months when I didn't used the app so the overall figure for average becomes inaccurate. Also the Piechart distribution is inaccurate when there are a lot of categories and data. Please fix the issues.
27 people found this review helpful
What's new
Bugfixes and improvements.
Automatic Backup is now using Google Drive.
Automatic Backup is now using Google Drive.


