Peak Flow

4.5star
285 reviews
50K+
Downloads

PEGI 3
info
About this app
Peak Flow allows you to record your daily peak flow readings and helps you to keep track of your Asthma.
Features
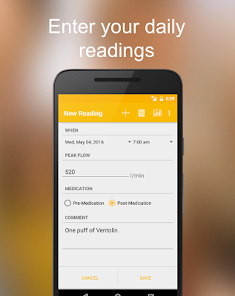
- Record peak expiratory flow (PEF).
- Specify if a reading is taken pre or post medication.
- Record comments against your readings.
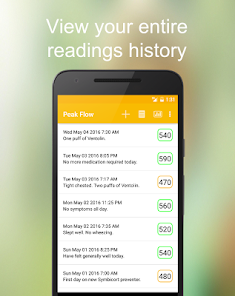
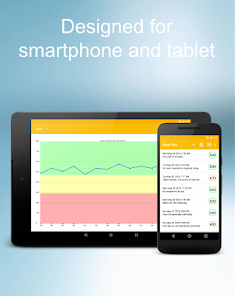
- View your most recent readings at a glance or scroll through your entire history.
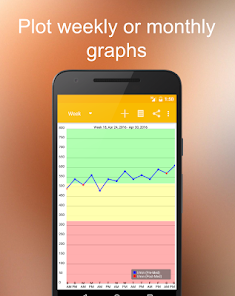
- Plot your results as weekly or monthly graphs.
- Automatically calculate and plot your green, yellow and red zones along with your personal best.
- Share your graphs over services such as Email, Bluetooth and Instant Message
- Export your data to SD card or upload it to a storage service such as Google Drive.
- Support for English and German languages.
Required Permissions
- Photos / Media / File - This permission is required to allow Peak Flow to export data to local storage.
Features
- Record peak expiratory flow (PEF).
- Specify if a reading is taken pre or post medication.
- Record comments against your readings.
- View your most recent readings at a glance or scroll through your entire history.
- Plot your results as weekly or monthly graphs.
- Automatically calculate and plot your green, yellow and red zones along with your personal best.
- Share your graphs over services such as Email, Bluetooth and Instant Message
- Export your data to SD card or upload it to a storage service such as Google Drive.
- Support for English and German languages.
Required Permissions
- Photos / Media / File - This permission is required to allow Peak Flow to export data to local storage.
Updated on
Safety starts with understanding how developers collect and share your data. Data privacy and security practices may vary based on your use, region, and age. The developer provided this information and may update it over time.

No data shared with third parties
Learn more about how developers declare sharing

No data collected
Learn more about how developers declare collection
Ratings and reviews
4.4
260 reviews

Janet Swinney
- Flag inappropriate
May 1, 2022
Very good. A big improvement on the app I was using previously. I like the fact that the readings show up against 'low', 'normal', 'high' bands and being able to view them in graph format. Being able to add comments is helpful. This gives meaning to the numbers, and helps you remember things you would otherwise forget. Thanks for developing this app.
10 people found this review helpful
Ben Hills
May 1, 2022
Thank you Janet for such great feedback. I'm glad you are finding Peak Flow useful.

Tara Neve-Scott
- Flag inappropriate
July 14, 2022
This app has been really helpful as a log to keep an eye on my peak flow- especially with my bought of covid/covid exacerbated asthma. Only improvement would be if I could fully edit my zones- I know my top and bottom end but there's only possibility to add my top end which doesn't quite modify the colour bands (which are super useful!) enough to be inline for me!
3 people found this review helpful
Ben Hills
September 8, 2022
Hi, I am glad you are finding the app helpful. The app currently uses a standard calculation against your personal best value to set the coloured zones, but this does not fit everyone so I do plan to add fully customisable zones in a future update. Thank you for the feedback.

Gemma Turner
- Flag inappropriate
November 12, 2020
Really useful app. A couple of suggestions, make scrolling between weeks and months continuous rather than one month at a time. It's hard to properly see trends across two months. Also frustrating not to be able to see trends throughout the day which would be helpful in an exacerbation.
9 people found this review helpful
Ben Hills
November 17, 2020
Thank you Gemma for your suggestions. A daily report is definitely coming in the near future, and I will add scrolling charts to the list of ideas to investigate. Thanks for your feedback.
What's new
Add support for Android 12+
Daily chart.
Daily chart.