
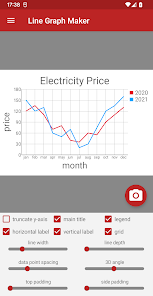
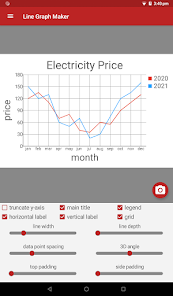
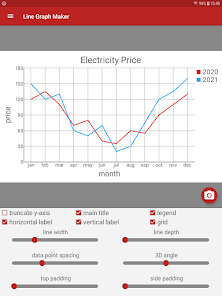
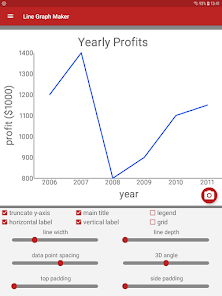
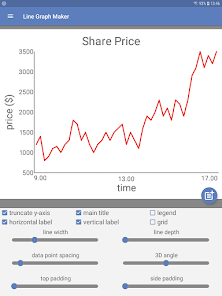
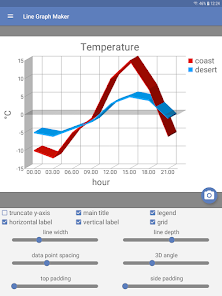
Line Graph Maker
Contains ads
3.8star
335 reviews
100K+
Downloads

Everyone
info


About this app
Safety starts with understanding how developers collect and share your data. Data privacy and security practices may vary based on your use, region, and age. The developer provided this information and may update it over time.

This app may share these data types with third parties
Location, App activity and 2 others

No data collected
Learn more about how developers declare collection

Data is encrypted in transit

You can request that data be deleted
Ratings and reviews
3.8
313 reviews

kazul24
- Flag inappropriate
January 1, 2024
Excellent app!! It is to the point, has an easy intuitive interface, and the ads are present but not overbearing. It could easily be 5 stars BUT there are finishing touches missing: - There is no UNDO button ( my biggest complaint) - You cannot label points on the Y-axis from the spreadsheet, only from the graph view. - When you add text to the graph it does not lock into place, so it will shift when you adjust the graph size. I have a few other nit picks but all in all it is a wonderful app!!
3 people found this review helpful

Brandon
- Flag inappropriate
April 22, 2023
I really enjoy this app but how do I make another graph? I don't really see a way to save a graph and or to reset the graph. It would also be nice to be able to click only once when trying to add what each point represents on the graph if there was a way to know like instantly fill out the bottom section. Like I was doing 1 on inflation over 223years and to show what y intervals mean. It auto does the x axis for you but not the y.
5 people found this review helpful
Philip Stephens
April 22, 2023
To save and load the graph or start a new graph, press and hold the button for drawing the graph on the data entry screen. If you update to the latest version, you have more control over the scale of the y-axis. If you want to show more detail on the graph's data points, use text labels. Press and hold on the camera button to access text labels.

Casey Zaugg
- Flag inappropriate
February 14, 2023
This is the first graphing program that hasn't made me want to tear my hair out in frustration. The app is simple to use and takes you through a quick tutorial as you go. It's easy to add data and titles, and you can save the images directly onto your phone. 10/10 would recommend over Canva in terms of ease of use.
8 people found this review helpful
What's new
Adjustable height scale.


