TheThingV ThingSpeak/InfluxDB
In-app purchases
1K+
Downloads

Everyone
info


About this app
TheThingV is a viewer app for Thingspeak and for InfluxDB raw data.
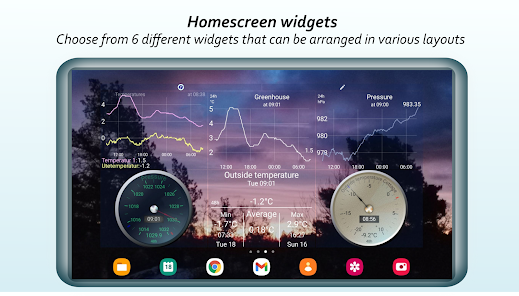
Data can be visualized in both the app and in homescreen widgets like dashboards.
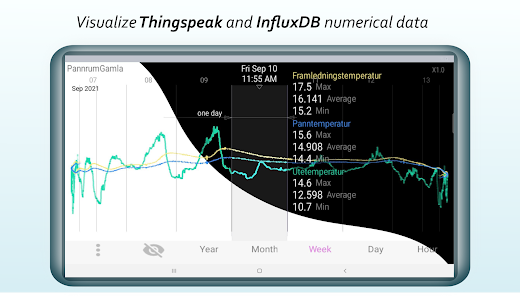
ThingSpeak™ is an open source IoT (Internet of Things) platform to store and retrieve data from things using HTTP over internet.
For more info please visit https://thingspeak.com.
Influxdb is a timeseries database, for more info please visit https://www.influxdata.com
Note: TheThingV currently supports influxDB V2.XX , older versions are not supported.
With ThingSpeak™ or InfluxDB you can create DIY sensor logging applications and monitor for example your greenhouse or make a weather station.
TheThingv makes it easy and fast to view your recent and historical ThingSpeak™ data. There is also support for InfluxDB so you can mix fields from both Thingspeak and InfluxDB in the same channel.
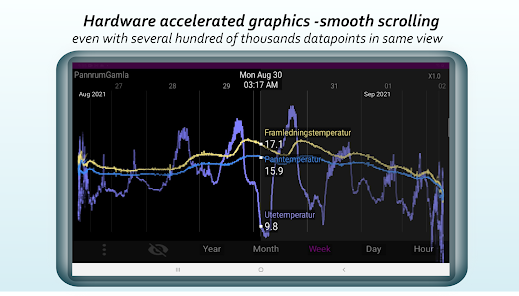
TheThingV can handle several hundreds of thousands datapoints and still keep smooth scrolling thanks to hardware accelerated graphics (of course the amount of memory available can limit this).
TheThingV stores downloaded data so next time you start the app you will have instant access to your historical data. Recent data is added automatically and saved when you are using the app.
ThingSpeak delivers data in maximum 8000 rows size but TheThingV seemlessly adds 8000 rows chunks to your data until the desired timespan is filled.
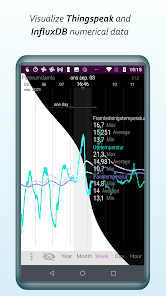
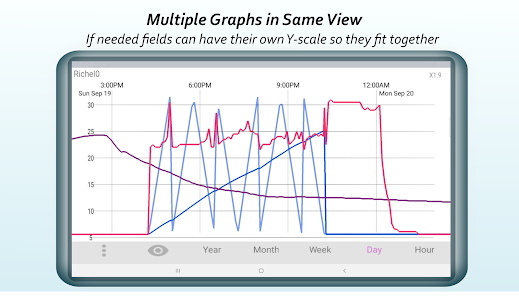
TheThingV can display single and multiple graphs in the same view. If you have multiple fields with big differences in values you can just choose different Y-scales. Y-scales normally can be set to auto. However sometimes you may want to manually set min and max values. You can also name them as you want.
Features
✔ View multiple graphs in same view with optionally different Y-scales
✔ View fields from both Thingspeak and InfluxDB in the same view
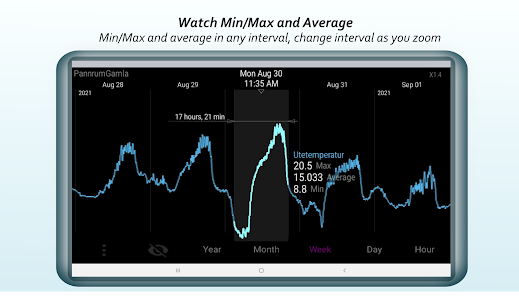
✔ View values or min/max and average in any interval
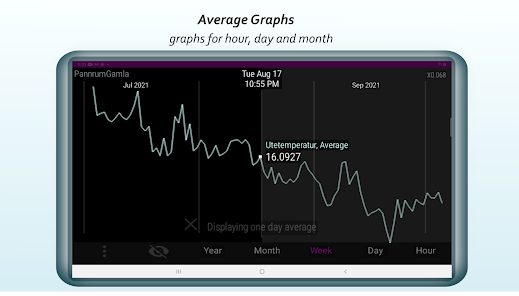
✔ Show average graphs for hour, day, week and month
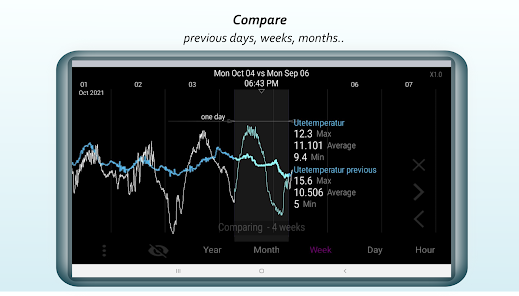
✔ Compare hours, days,weeks, months single or multiple fields
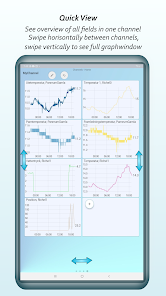
✔ Make combined channels and put together any field in the same view
✔ Smooth scrolling and zooming including doubletap zoomin/zoomout
✔ Linear, nonlinear and logarithmic scale
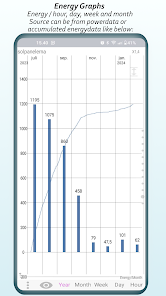
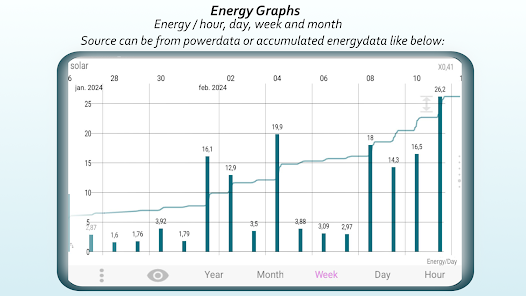
✔ Energy graphs: convert powergraphs to energy
✔ No 8000 row limit
✔ No need to download already stored data, faster access
✔ Choose 12 or 24 hour format
✔ View multiple graphs in same view
✔ Choose background and graph colors
✔ Linear X-axis or ”wheel”
✔ For paid users it's possible to export and import settings and data
Data can be visualized in both the app and in homescreen widgets like dashboards.
ThingSpeak™ is an open source IoT (Internet of Things) platform to store and retrieve data from things using HTTP over internet.
For more info please visit https://thingspeak.com.
Influxdb is a timeseries database, for more info please visit https://www.influxdata.com
Note: TheThingV currently supports influxDB V2.XX , older versions are not supported.
With ThingSpeak™ or InfluxDB you can create DIY sensor logging applications and monitor for example your greenhouse or make a weather station.
TheThingv makes it easy and fast to view your recent and historical ThingSpeak™ data. There is also support for InfluxDB so you can mix fields from both Thingspeak and InfluxDB in the same channel.
TheThingV can handle several hundreds of thousands datapoints and still keep smooth scrolling thanks to hardware accelerated graphics (of course the amount of memory available can limit this).
TheThingV stores downloaded data so next time you start the app you will have instant access to your historical data. Recent data is added automatically and saved when you are using the app.
ThingSpeak delivers data in maximum 8000 rows size but TheThingV seemlessly adds 8000 rows chunks to your data until the desired timespan is filled.
TheThingV can display single and multiple graphs in the same view. If you have multiple fields with big differences in values you can just choose different Y-scales. Y-scales normally can be set to auto. However sometimes you may want to manually set min and max values. You can also name them as you want.
Features
✔ View multiple graphs in same view with optionally different Y-scales
✔ View fields from both Thingspeak and InfluxDB in the same view
✔ View values or min/max and average in any interval
✔ Show average graphs for hour, day, week and month
✔ Compare hours, days,weeks, months single or multiple fields
✔ Make combined channels and put together any field in the same view
✔ Smooth scrolling and zooming including doubletap zoomin/zoomout
✔ Linear, nonlinear and logarithmic scale
✔ Energy graphs: convert powergraphs to energy
✔ No 8000 row limit
✔ No need to download already stored data, faster access
✔ Choose 12 or 24 hour format
✔ View multiple graphs in same view
✔ Choose background and graph colors
✔ Linear X-axis or ”wheel”
✔ For paid users it's possible to export and import settings and data
Updated on
Safety starts with understanding how developers collect and share your data. Data privacy and security practices may vary based on your use, region, and age. The developer provided this information and may update it over time.

No data shared with third parties
Learn more about how developers declare sharing

This app may collect these data types
App info and performance

Data is encrypted in transit

Data can’t be deleted
What's new
Now it's possible to generate energy bar-graphs from power- or accumulated energydata.
Added an option to watch First/Diff/Last in selected interval.
Also some minor improvements and bugfixes.
Added an option to watch First/Diff/Last in selected interval.
Also some minor improvements and bugfixes.


