
Compound Interest Calculator
Contains adsIn-app purchases
1K+
Downloads

Everyone
info


About this app
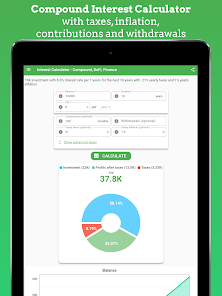
Compound interest calculator for personal finance or DeFi calculations.
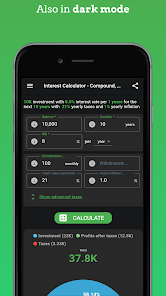
Fully customizable, you can choose duration and periods by years, months, weeks or days. You can also choose between a single tax range or configure multiple ranges in the advanced tax section.
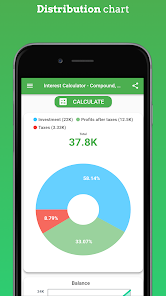
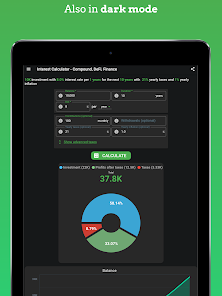
- Pie chart with the distribution of initial investment, profits and taxes.
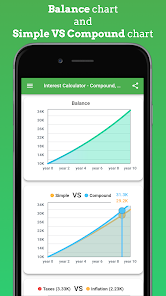
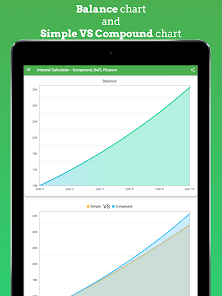
- Line chart with Simple VS Compound interest.
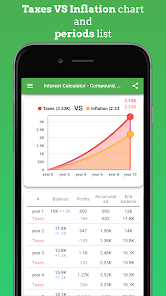
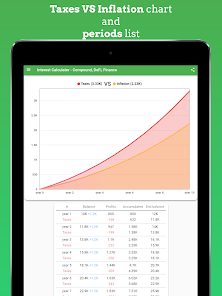
- Line chart with Taxes VS Inflation.
You will also have a breakdown of all the periods in which the initial balance, contributions, final balance, withdrawals, taxes, period profits or accumulated profits up to that period will be displayed.
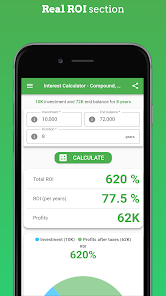
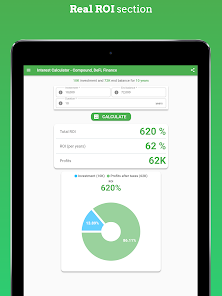
You will be able to make inverse calculations from the initial investment, ending balance and duration. In this way you will obtain the real ROI of an investment.
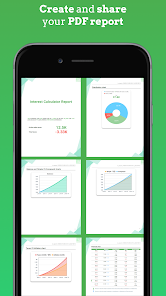
With both compound interest and real ROI calculations you will be able to create and share a PDF report with the same data shown in the application.
For added convenience, a web version is also provided which can be accessed from your PC. The link can be obtained from within the application.
Fully customizable, you can choose duration and periods by years, months, weeks or days. You can also choose between a single tax range or configure multiple ranges in the advanced tax section.
Multiple charts
- Pie chart with the distribution of initial investment, profits and taxes.
- Line chart with Simple VS Compound interest.
- Line chart with Taxes VS Inflation.
You will also have a breakdown of all the periods in which the initial balance, contributions, final balance, withdrawals, taxes, period profits or accumulated profits up to that period will be displayed.
You will be able to make inverse calculations from the initial investment, ending balance and duration. In this way you will obtain the real ROI of an investment.
With both compound interest and real ROI calculations you will be able to create and share a PDF report with the same data shown in the application.
For added convenience, a web version is also provided which can be accessed from your PC. The link can be obtained from within the application.
Updated on
Safety starts with understanding how developers collect and share your data. Data privacy and security practices may vary based on your use, region, and age. The developer provided this information and may update it over time.


What's new
Improvements in the visualization of charts and small bug fixes.

