

Stock Heat Map Professional
Contains adsIn-app purchases

4.6star
37 reviews
5K+
Downloads

Everyone
info


About this app
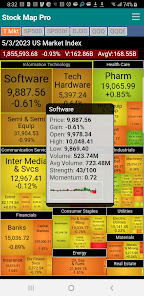
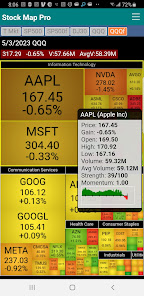
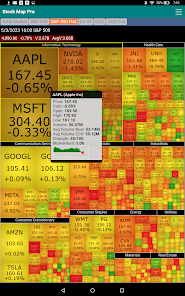
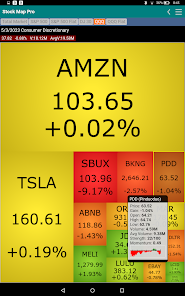
Stock market map (a.k.a. stock market heat map or stock market tree map) is a visual representation of stock market data. The size of the block in the map represents the market share of a component within its higher-level component in the hierarchy. The color of a component represents price change (gain or loss) percentage. A component on the map can be the end node (i.e., an individual stock), an industry group of multiple stocks, a market sector of multiple industries, or the entire market that the specific map is tracking.
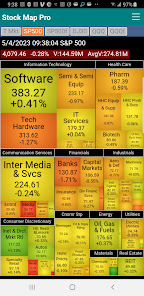
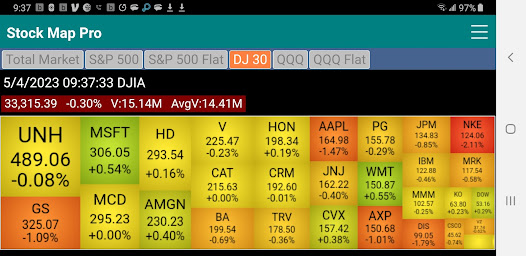
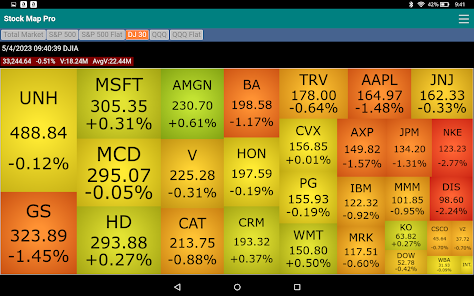
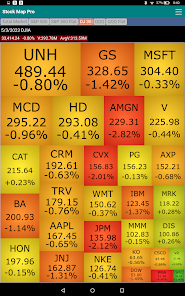
Stock Heat Map Professional Edition App (Stock Map Pro) contains six stock market heat maps in one app. It features the Total Market map, S&P 500 two-level map, S&P 500 flat map, Dow Jones 30 Industrial map, QQQ two-level map and QQQ flat map.
The Total Market map tracks more than 600 stocks traded on the US stock exchanges from major US companies and ADRs with the largest market capitalizations. The S&P 500 maps, DJ30 map and QQQ maps track the S&P 500 stocks, Dow Jones 30 Industrial stocks and Invesco QQQ ETF stocks respectively.
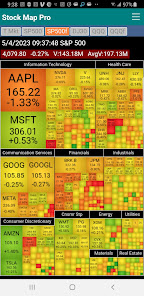
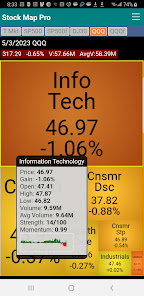
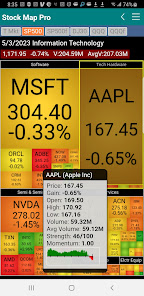
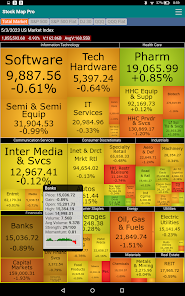
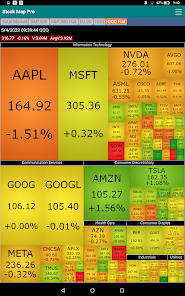
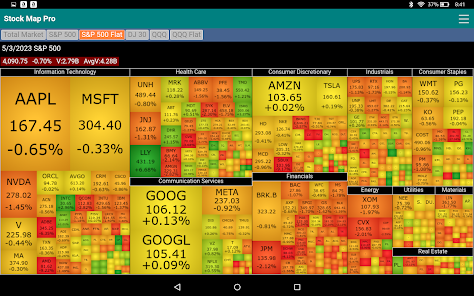
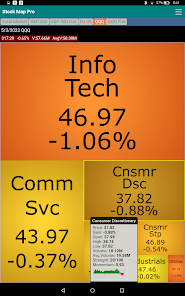
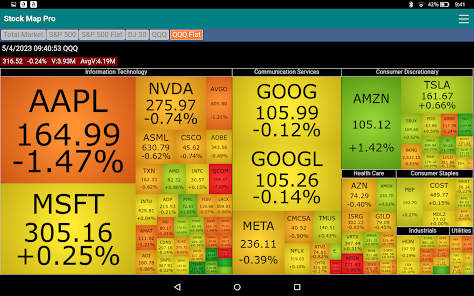
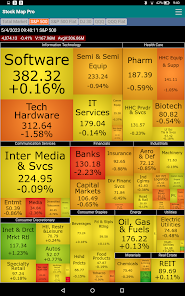
The stocks on a map are grouped in hierarchies. A market contains multiple sectors. A sector contains multiple industries. An industry contains multiple stocks. For maps with two levels, the first (root) level shows all the sectors and industries under each sector. The second level shows a specific sector and all the industries and stock under the sector. You need to navigate between the two levels to see all the stocks. For maps with one level (i.e., a “flat” map), all stocks are shown together.
The Total Market map, the S&P 500 map and the QQQ map have two levels. The first (root) level contains all the sectors and industries tracked by the markets. The second level contains a single sector and stocks under the sector. The DJ 30 map, S&P flat map and QQQ flat map have only one level.
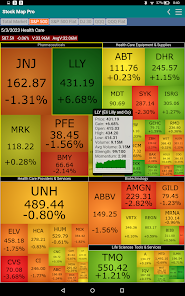
Market data come from real-time quotes when market is open and show End-of-Date data after market close (4pm Eastern Time) and then finalized at around 8:05 pm when after hour trading ends. Data on the maps got refreshed automatically when the stock markets are opened. For each component (stock, industry index, sector index or the entire market) there is the latest price, price gain percentage, Open, high, low prices, volume, average volume and volume strength (intraday data are normalized to the portion of elapsed time within the session) and the price strength, which is the ranking of the price gain percentage of a component in comparison to all other components. There are also intraday pricing chart for every components.
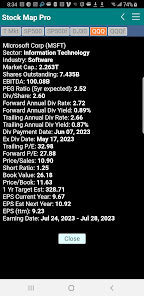
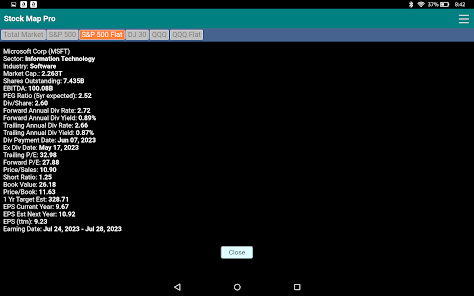
For individual stock, it also shows the fundamental data of the company, including market capitalization, outstanding shares, EBITDA, PEG Ratio, Dividend, forward and trailing dividend rate and yield, dividend payout date, ex div date, P/E, trailing and forward PE, price/sales, short ratio, book value, price/book, price target, current and forward EPS, EPS report date, … etc.
Stock Heat Map Professional Edition App (Stock Map Pro) contains six stock market heat maps in one app. It features the Total Market map, S&P 500 two-level map, S&P 500 flat map, Dow Jones 30 Industrial map, QQQ two-level map and QQQ flat map.
The Total Market map tracks more than 600 stocks traded on the US stock exchanges from major US companies and ADRs with the largest market capitalizations. The S&P 500 maps, DJ30 map and QQQ maps track the S&P 500 stocks, Dow Jones 30 Industrial stocks and Invesco QQQ ETF stocks respectively.
The stocks on a map are grouped in hierarchies. A market contains multiple sectors. A sector contains multiple industries. An industry contains multiple stocks. For maps with two levels, the first (root) level shows all the sectors and industries under each sector. The second level shows a specific sector and all the industries and stock under the sector. You need to navigate between the two levels to see all the stocks. For maps with one level (i.e., a “flat” map), all stocks are shown together.
The Total Market map, the S&P 500 map and the QQQ map have two levels. The first (root) level contains all the sectors and industries tracked by the markets. The second level contains a single sector and stocks under the sector. The DJ 30 map, S&P flat map and QQQ flat map have only one level.
Market data come from real-time quotes when market is open and show End-of-Date data after market close (4pm Eastern Time) and then finalized at around 8:05 pm when after hour trading ends. Data on the maps got refreshed automatically when the stock markets are opened. For each component (stock, industry index, sector index or the entire market) there is the latest price, price gain percentage, Open, high, low prices, volume, average volume and volume strength (intraday data are normalized to the portion of elapsed time within the session) and the price strength, which is the ranking of the price gain percentage of a component in comparison to all other components. There are also intraday pricing chart for every components.
For individual stock, it also shows the fundamental data of the company, including market capitalization, outstanding shares, EBITDA, PEG Ratio, Dividend, forward and trailing dividend rate and yield, dividend payout date, ex div date, P/E, trailing and forward PE, price/sales, short ratio, book value, price/book, price target, current and forward EPS, EPS report date, … etc.
Updated on
Safety starts with understanding how developers collect and share your data. Data privacy and security practices may vary based on your use, region, and age. The developer provided this information and may update it over time.

No data shared with third parties
Learn more about how developers declare sharing

No data collected
Learn more about how developers declare collection
Ratings and reviews
4.6
36 reviews

Peter Proia
- Flag inappropriate
May 27, 2022
This is the best stock heat map app. I can easily swtch between DJ30, SP500 and QQQ map and more. Many useful features.
1 person found this review helpful

Nancy Adler
- Flag inappropriate
September 2, 2022
Can easily switch between QQQ and DJ30 maps. That's awesome.

Imad Shukur
- Flag inappropriate
April 9, 2023
App doesn't show stock rate change in long-term
What's new
Add two new types of maps – S&P 500 Flat Map and QQQ Flat Map. Flat maps have only one level. They do not have the “Industry” hierarchy. The stock components are shown directly (under their sectors) on the maps.


