Stock Trade Entry Point
Contains adsIn-app purchases

1K+
Downloads

Rated for 3+
info


About this app
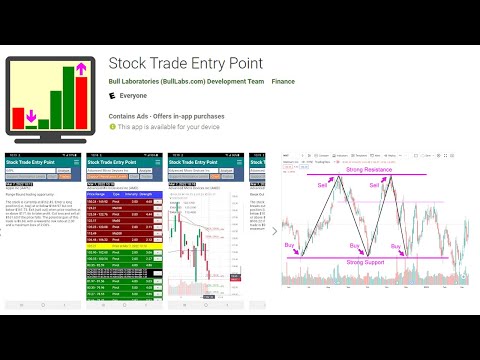
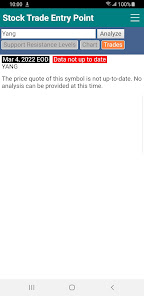
Use the Stock Trade Entry Point application to find trading opportunities as well as optimal entering and exiting prices and other setup for trades to maximize profits and minimize risks.
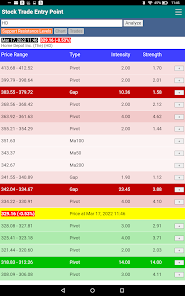
The analysis starts with finding support and resistance levels based on pivot points, gaps and major moving averages commonly used by traders. The strength of each support and resistance level is further determined by various characteristics of the levels including number of occurrences, volume strength and number of times they have succeeded or failed with providing support or resistance in the past, etc.
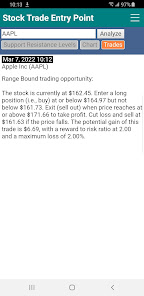
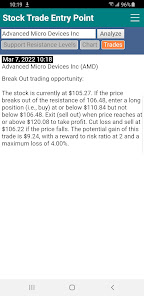
When US market is open, the analysis takes the real time price of the stock (or ETF) in comparison with its support and resistance levels to find suitable trading opportunities. Range bound strategy looks for a large price swing between strong support and resistance levels. Break out strategy looks for opportunities for a price movement to penetrate a resistance level and for the previous resistance level to become support. Break down strategy works similarly to the break out strategy but for the price going in the other direction. There are also cases when the price is going for a ride without any resistance or taking a dive without any support.
Once a suitable trading opportunity is found, the analyzer calculates the entering price with the setup criteria, exit price and cut loss price as well as the gain, maximum losses percentage, and reward-to-risk ratio.
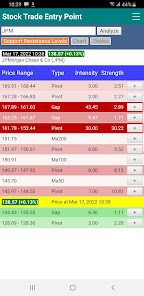
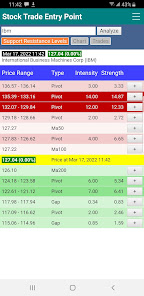
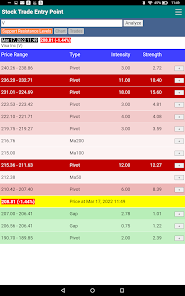
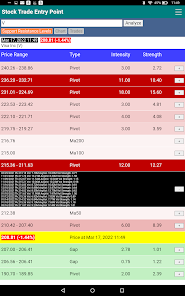
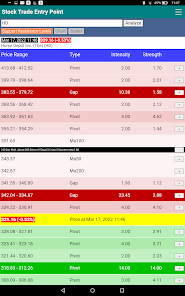
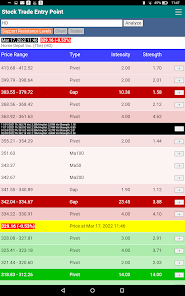
In the Summary screen, support resistance levels are shown with their price ranges, types, intensity and strength. You can also click the “+” (show details) button to bring up the detail view of the level. For the example of a pivot point level, the detail view shows the occurrence of each pivot point instance with its date, price, volume, average volume and volume strength.
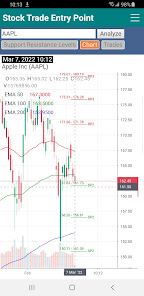
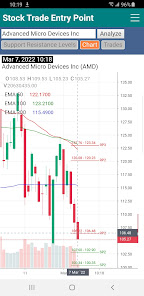
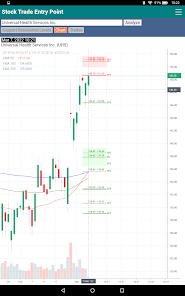
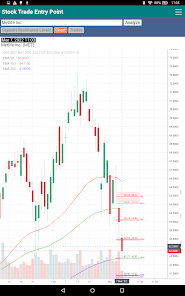
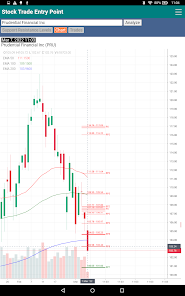
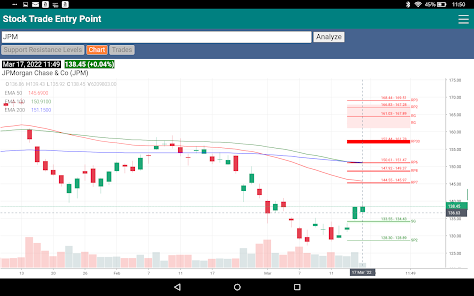
The Chart screen show the candle stick charting of the stock within the analysis date range. The last ticker (current price) is shown with the support resistance levels, gaps and EMAs, which gives a visual representation of where all the prices sit at as well as the strength of the supports and resistances.
The analysis starts with finding support and resistance levels based on pivot points, gaps and major moving averages commonly used by traders. The strength of each support and resistance level is further determined by various characteristics of the levels including number of occurrences, volume strength and number of times they have succeeded or failed with providing support or resistance in the past, etc.
When US market is open, the analysis takes the real time price of the stock (or ETF) in comparison with its support and resistance levels to find suitable trading opportunities. Range bound strategy looks for a large price swing between strong support and resistance levels. Break out strategy looks for opportunities for a price movement to penetrate a resistance level and for the previous resistance level to become support. Break down strategy works similarly to the break out strategy but for the price going in the other direction. There are also cases when the price is going for a ride without any resistance or taking a dive without any support.
Once a suitable trading opportunity is found, the analyzer calculates the entering price with the setup criteria, exit price and cut loss price as well as the gain, maximum losses percentage, and reward-to-risk ratio.
In the Summary screen, support resistance levels are shown with their price ranges, types, intensity and strength. You can also click the “+” (show details) button to bring up the detail view of the level. For the example of a pivot point level, the detail view shows the occurrence of each pivot point instance with its date, price, volume, average volume and volume strength.
The Chart screen show the candle stick charting of the stock within the analysis date range. The last ticker (current price) is shown with the support resistance levels, gaps and EMAs, which gives a visual representation of where all the prices sit at as well as the strength of the supports and resistances.
Updated on
Safety starts with understanding how developers collect and share your data. Data privacy and security practices may vary based on your use, region, and age. The developer provided this information and may update it over time.

No data shared with third parties
Learn more about how developers declare sharing

No data collected
Learn more about how developers declare collection
What's new
.Color shades for representing strengths of support resistance levels for easy understanding of where current price stand in one glimpse.
.Include more data (current price and change percentage from previous close) on various screens for easy usages.
.Include more data (current price and change percentage from previous close) on various screens for easy usages.


