Technical Analysis
Contains adsIn-app purchases

4.8star
141 reviews
50K+
Downloads

Rated for 3+
info


About this app
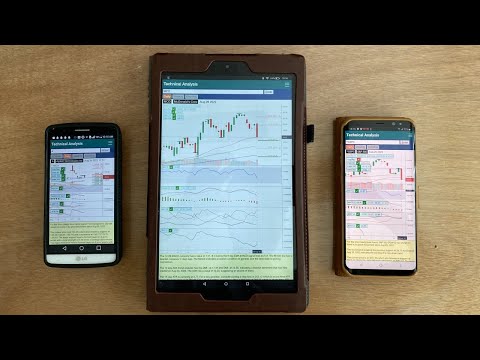
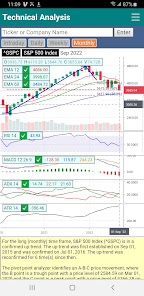
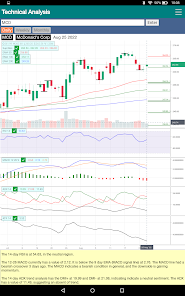
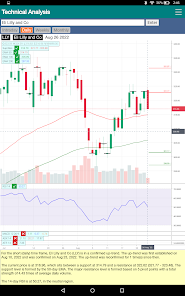
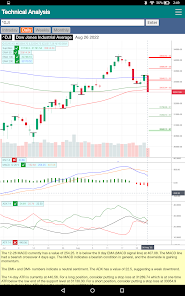
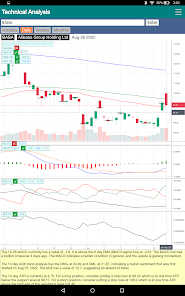
Stock market technical analysis in intraday, daily, weekly and monthly timeframes for stocks, ETFs and Indexes.
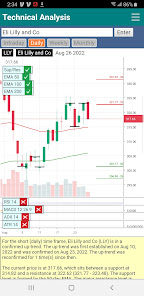
Trend analysis identifies the price movement trends using pivot points (peaks and troughs). It also gives price levels to watch out for trend reversals and changes in the future.
Support and resistance analysis identifies support resistance levels using moving averages, pivot points, pricing patterns and gaps. It also gives quantitative description of the support and resistance strength based on the analyzing of volumes and occurrences.
Up/down volume analysis identifies accumulation or distribution conditions using the A/D ratio.
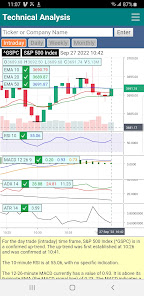
Traditional technical analysis include RSI, MACD, ADX, Bollinger Bands and ATR indicators.
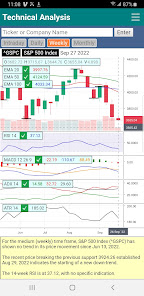
For RSI, it identifies overbought and oversold conditions in a range-bound (non-trending) market. In a trending market, it signals trend reversal by looking for divergences between the movements of pricing and the indicator.
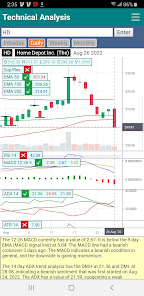
For MACD, it describes bullish or bearish sentiment with pricing momentum and gives alerts of bullish and bearish crossover in the signal line.
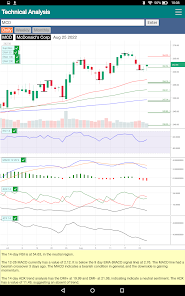
For the ADX indicator, it interprets trend strength and direction based on DMI+, DMI- and ADX lines.
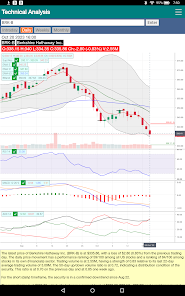
Bollinger bands analyzer (new for version 5) interprets the current pricing positions against the bands. It also analyzes the %b value against historical volatility for the band to be in the squeeze or bulge conditions to identify the beginning or the end of a movement.
The ATR analysis indicates volatility of pricing changes to find profitable entry and exit levels of trades.
Candlestick analyzer finds candlestick patterns.
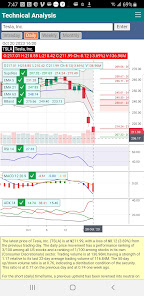
Daily summary analysis compares price performance of a security against the general market as well as other securities in its own industry. The volume strength measures the trading volume against its own recent average volume at the same time fraction during a trading day. High volume strength can be used to confirm price movements and low volume strength signals the lack of conviction of the changes.
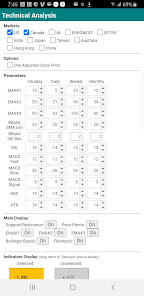
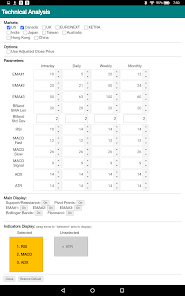
The parameters for moving averages and indicators are fully customizable for each timeframe.
Other than the USA and Canadian (TSX) markets, the app also supports UK (LSE), Europe (EURONEXT and XETRA), India (NSE), Japan (XTKS, XFKA and XSAP), Taiwan (XTAI and ROCO), Australia (ASX), Hong Kong (XHKG) and China (XSHE and XSHG) markets.
Version 4.5 and later include the option of using Adjusted Close Price. Adjusted close is the closing price after adjustments for all applicable splits and dividend distributions. Data is adjusted using appropriate split and dividend multipliers, adhering to Center for Research in Security Prices (CRSP) standards.
Trend analysis identifies the price movement trends using pivot points (peaks and troughs). It also gives price levels to watch out for trend reversals and changes in the future.
Support and resistance analysis identifies support resistance levels using moving averages, pivot points, pricing patterns and gaps. It also gives quantitative description of the support and resistance strength based on the analyzing of volumes and occurrences.
Up/down volume analysis identifies accumulation or distribution conditions using the A/D ratio.
Traditional technical analysis include RSI, MACD, ADX, Bollinger Bands and ATR indicators.
For RSI, it identifies overbought and oversold conditions in a range-bound (non-trending) market. In a trending market, it signals trend reversal by looking for divergences between the movements of pricing and the indicator.
For MACD, it describes bullish or bearish sentiment with pricing momentum and gives alerts of bullish and bearish crossover in the signal line.
For the ADX indicator, it interprets trend strength and direction based on DMI+, DMI- and ADX lines.
Bollinger bands analyzer (new for version 5) interprets the current pricing positions against the bands. It also analyzes the %b value against historical volatility for the band to be in the squeeze or bulge conditions to identify the beginning or the end of a movement.
The ATR analysis indicates volatility of pricing changes to find profitable entry and exit levels of trades.
Candlestick analyzer finds candlestick patterns.
Daily summary analysis compares price performance of a security against the general market as well as other securities in its own industry. The volume strength measures the trading volume against its own recent average volume at the same time fraction during a trading day. High volume strength can be used to confirm price movements and low volume strength signals the lack of conviction of the changes.
The parameters for moving averages and indicators are fully customizable for each timeframe.
Other than the USA and Canadian (TSX) markets, the app also supports UK (LSE), Europe (EURONEXT and XETRA), India (NSE), Japan (XTKS, XFKA and XSAP), Taiwan (XTAI and ROCO), Australia (ASX), Hong Kong (XHKG) and China (XSHE and XSHG) markets.
Version 4.5 and later include the option of using Adjusted Close Price. Adjusted close is the closing price after adjustments for all applicable splits and dividend distributions. Data is adjusted using appropriate split and dividend multipliers, adhering to Center for Research in Security Prices (CRSP) standards.
Updated on
Safety starts with understanding how developers collect and share your data. Data privacy and security practices may vary based on your use, region, and age. The developer provided this information and may update it over time.

No data shared with third parties
Learn more about how developers declare sharing

No data collected
Learn more about how developers declare collection
Ratings and reviews
4.8
141 reviews

David Jones
- Flag inappropriate
November 26, 2022
Very nice app. Gives good interpretation of indicators to quickly know how the stocks (and the general market) are doing in different timeframes.
18 people found this review helpful

B. K. Hutterer
- Flag inappropriate
March 4, 2023
Really great graphs for medium-term swing traders like myself. The ability to toggle the EMA to 5-8-13 has helped me paint a clearer picture of when I should buy.
13 people found this review helpful

Meiping Yao
- Flag inappropriate
August 18, 2022
Pivot points and ADX interpretation helped me a lot in early id of trend reversal. Very nice!
12 people found this review helpful
What's new
.Add Bollinger Bands indicators and Bollinger Band analysis.
.Add daily price gain strength and volume strength analysis (on daily timeframe only).
.Add Up/Down volume analysis.
.Add candlestick pattern analysis.
.Improved trend analysis with price levels for early lookout of trend changes.
.Include options to turn on/off pivot points and Fibonacci lines on the main chart.


