
S&P 500 Stock Map
Contains adsIn-app purchases
3.7star
120 reviews
10K+
Downloads

Rated for 3+
info


About this app
.S&P500 Stock Market Heat Map
.Intraday Market Data update every minute when stock market opens
.Three levels of map: Entire index, Sector, and Industry maps
.Performance (Gain), Volume, Average Volume and Index values on Sectors, Industries as well as individual stocks.
."Strength" measures strength of the price movement of a stock compared to others using real time data.
."Momentum" measures trading volume of a stock compared to its own average volume using real time data. Intraday volume strength compares average volume normalized to portion of time elapsed in the session.
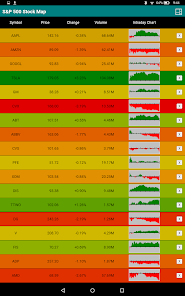
.Intraday price chart for all components - stocks, industries, sectors and entire index.
.Colorful representation of gain and loss of indexes and stocks.
.Block sizes represent Market Capitalization of components.
.11 Sectors and 65 Industries.
.S&P 500 compositions and allocations.
.Company fundamental data including market cap, earnings, dividend, short ratio ... and much more.
.Watch list displays custom list of stocks.
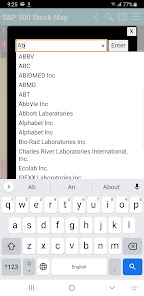
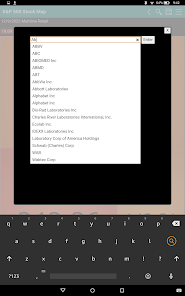
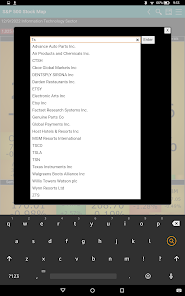
.Search for stock by symbol and name.
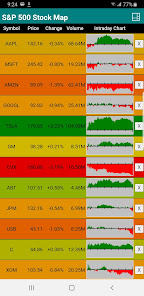
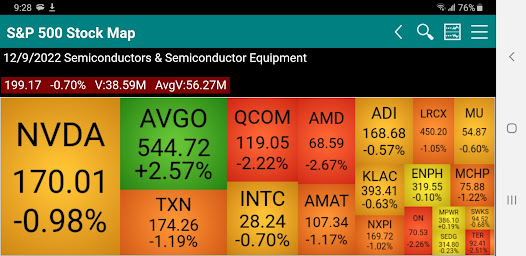
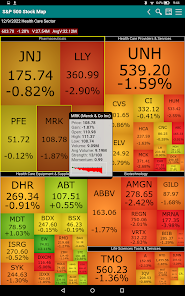
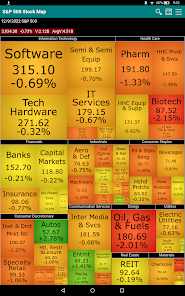
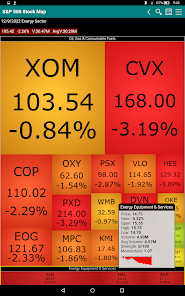
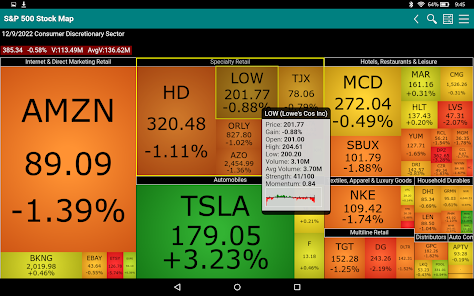
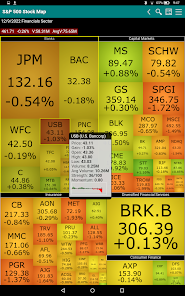
Stock Market Map is a visual representation of stock market data. This specific map categorizes S&P 500 stocks into sectors and industries. The top-level map consists of sectors of the entire market and all the industries under each specific sector. The second-level map starts with a specific sector and consists of all the industries and then all the individual company’s stock under each industry. It is an investment research tool let you quickly view the performance of different sectors, industries and individual companies. The size of the block in the map represents the values of the component (stock or industry) within the portfolio of its parent (industry or sector). The color of the block represents the daily price movement of the component. The overall performance of the entire stock market and/or individual sector can be easily grasped by a glimpse to the map by the color and size of the blocks.
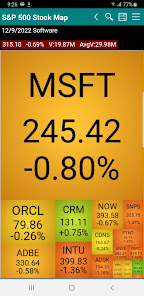
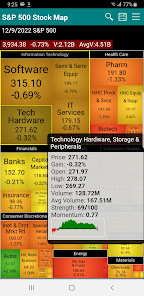
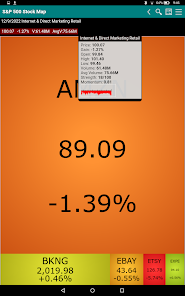
Tapping a block brings up a popup box showing the name, real time price, price gain, volume and the 13 week average volume, relative pricing strength , volume momentum and pricing chart (version 3 new feature) of the sector, industry or individual stock. The name of each component is labeled on top of each block. Double tapping any block from the top-level map navigates to the second-level map of the sector that the block belongs. Tap the back button on the title bar or the back button on the mobile device to navigate back to the top-level map.
The S&P 500 Stock Map tracks stocks using the same compositions and allocations of stocks in the S&P 500 index. The prices, volumes, average volumes and other information of sectors and industries are calculated similarly by BullLabs.com. Indexes are calculated based on the market capitalization of underlying stocks or industries in the level. Sector and Industry specific indexes allow investors to benchmark the performance of investment based on specific stock market sectors or industries. Just as all stocks tend to move based on the underlying factors that drive the overall market, stocks in a similar industry tend to move based on underlying factors that affect the industry. One of the most basic methods for understanding the risk of an investment portfolio is to determine its sector breakdown. Is the portfolio spread across different industrial sectors or is it concentrated in just a few? This provides a good indication of how an investment portfolio will respond to macroeconomic factors or industry trends.
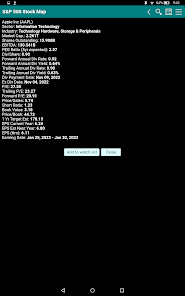
Company fundamental data include Market capitalization, outstanding shares, EBITDA, PEG Ratio, Dividend per share, forward and trailing dividend rate and yield, dividend payout date, ex div date, P/E, trailing and forward PE, price/sales, short ratio, book value, price/book, price target, current and forward EPS, EPS report date, EPS ttm, Basic EPA, Diluted EPS, High/Low EPS estimation, number of analysts.
.Intraday Market Data update every minute when stock market opens
.Three levels of map: Entire index, Sector, and Industry maps
.Performance (Gain), Volume, Average Volume and Index values on Sectors, Industries as well as individual stocks.
."Strength" measures strength of the price movement of a stock compared to others using real time data.
."Momentum" measures trading volume of a stock compared to its own average volume using real time data. Intraday volume strength compares average volume normalized to portion of time elapsed in the session.
.Intraday price chart for all components - stocks, industries, sectors and entire index.
.Colorful representation of gain and loss of indexes and stocks.
.Block sizes represent Market Capitalization of components.
.11 Sectors and 65 Industries.
.S&P 500 compositions and allocations.
.Company fundamental data including market cap, earnings, dividend, short ratio ... and much more.
.Watch list displays custom list of stocks.
.Search for stock by symbol and name.
Stock Market Map is a visual representation of stock market data. This specific map categorizes S&P 500 stocks into sectors and industries. The top-level map consists of sectors of the entire market and all the industries under each specific sector. The second-level map starts with a specific sector and consists of all the industries and then all the individual company’s stock under each industry. It is an investment research tool let you quickly view the performance of different sectors, industries and individual companies. The size of the block in the map represents the values of the component (stock or industry) within the portfolio of its parent (industry or sector). The color of the block represents the daily price movement of the component. The overall performance of the entire stock market and/or individual sector can be easily grasped by a glimpse to the map by the color and size of the blocks.
Tapping a block brings up a popup box showing the name, real time price, price gain, volume and the 13 week average volume, relative pricing strength , volume momentum and pricing chart (version 3 new feature) of the sector, industry or individual stock. The name of each component is labeled on top of each block. Double tapping any block from the top-level map navigates to the second-level map of the sector that the block belongs. Tap the back button on the title bar or the back button on the mobile device to navigate back to the top-level map.
The S&P 500 Stock Map tracks stocks using the same compositions and allocations of stocks in the S&P 500 index. The prices, volumes, average volumes and other information of sectors and industries are calculated similarly by BullLabs.com. Indexes are calculated based on the market capitalization of underlying stocks or industries in the level. Sector and Industry specific indexes allow investors to benchmark the performance of investment based on specific stock market sectors or industries. Just as all stocks tend to move based on the underlying factors that drive the overall market, stocks in a similar industry tend to move based on underlying factors that affect the industry. One of the most basic methods for understanding the risk of an investment portfolio is to determine its sector breakdown. Is the portfolio spread across different industrial sectors or is it concentrated in just a few? This provides a good indication of how an investment portfolio will respond to macroeconomic factors or industry trends.
Company fundamental data include Market capitalization, outstanding shares, EBITDA, PEG Ratio, Dividend per share, forward and trailing dividend rate and yield, dividend payout date, ex div date, P/E, trailing and forward PE, price/sales, short ratio, book value, price/book, price target, current and forward EPS, EPS report date, EPS ttm, Basic EPA, Diluted EPS, High/Low EPS estimation, number of analysts.
Updated on
Safety starts with understanding how developers collect and share your data. Data privacy and security practices may vary based on your use, region, and age. The developer provided this information and may update it over time.

No data shared with third parties
Learn more about how developers declare sharing

No data collected
Learn more about how developers declare collection
Ratings and reviews
3.9
111 reviews

Bradley Bender
- Flag inappropriate
- Show review history
November 21, 2022
I'm trying out all 3 of their products. Great concept, and lots of good info. But on the phone it can be difficult to go down in to the subcategories and see who is included. Many smaller stocks are totally hidden. Needs a way to pinch to zoom, or swipe, or scroll down.
28 people found this review helpful

Peter Proia
- Flag inappropriate
December 8, 2020
Great app. Should be valuable tool for every stock trader. Very easy to get a feel of what the market is currently doing. Suggest to have an option to show stocks (instead of sectors and industry groups) as the top level map. For example, show the largest cap stock in that group or the biggest price mover.
44 people found this review helpful

Kornelius Cunningham
- Flag inappropriate
December 17, 2022
I get a black screen when app opens now, I uninstalled n install it back, same results, plz help dis app!!! It worked fine b4 idk what's going on now.!?
4 people found this review helpful
What's new
Maintenance release to fix display issue


