

Dow Jones 30 Stocks Heat Map
Contains adsIn-app purchases

1K+
Downloads

Rated for 3+
info


About this app
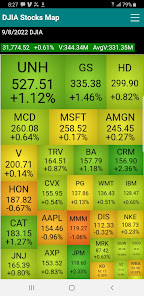
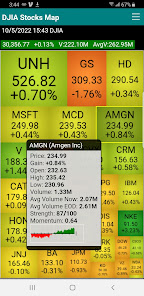
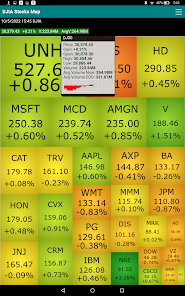
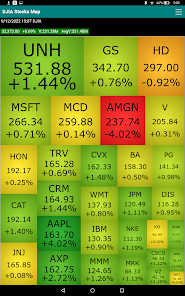
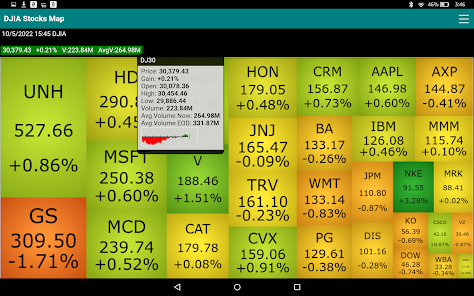
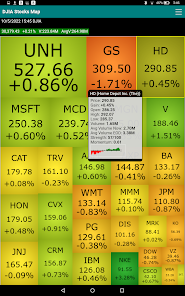
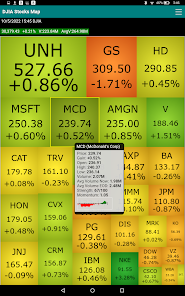
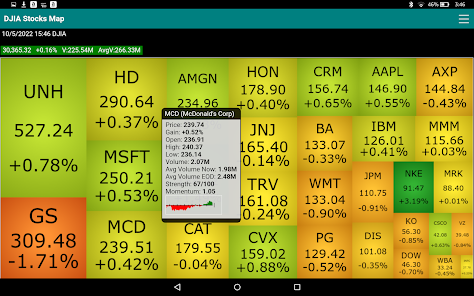
Stock Market Map (Heat Map a.k.a Tree Map) is a visual representation of stock market data. The size of each block represents the allocation of the stock within the entire composition. The color of each block represents gain or loss of the stock. The overall performance of the Dow Jones 30 components can be easily grasped by a glimpse to the map.
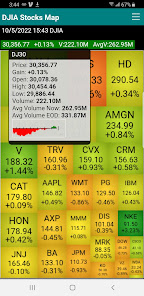
The detail information include Open, High, Low, Close price, Gain, Volume, 3-month average volume as well as the relative strength and volume momentum of each stock. Intraday Market Data update every minute when stock market opens. Price related data are finalized at 4 pm Eastern time when market close. Volume related data are finalized at 8 pm Eastern time to include after-hour trading volumes. Version 3 or higher include the intraday pricing charts.
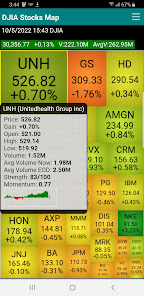
The relative strength is a measurement of the ROI ranking of a stock compared to other stocks. The volume momentum measures trading volume of a stock compared to its own average volume from the recent 3-month period. Both the "Average Volume" and "Momentum" numbers are adjusted to the portion of the current intraday trading period automatically. They are also normalized to the high volume movements at market open and before market close.
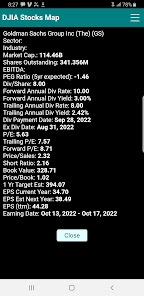
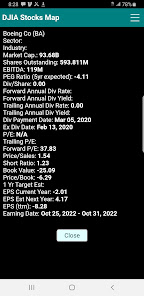
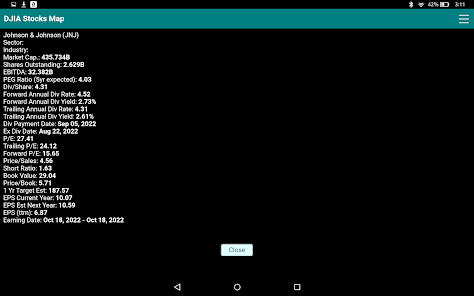
Version 3.1+ have Company fundamental data added. Company fundamental data include Market capitalization, outstanding shares, EBITDA, PEG Ratio, Dividend per share, forward and trailing dividend rate and yield, dividend payout date, ex div date, P/E, trailing and forward PE, price/sales, short ratio, book value, price/book, price target, current and forward EPS, EPS report date, EPS ttm, Basic EPA, Diluted EPS, High/Low EPS estimation, number of analysts.
The detail information include Open, High, Low, Close price, Gain, Volume, 3-month average volume as well as the relative strength and volume momentum of each stock. Intraday Market Data update every minute when stock market opens. Price related data are finalized at 4 pm Eastern time when market close. Volume related data are finalized at 8 pm Eastern time to include after-hour trading volumes. Version 3 or higher include the intraday pricing charts.
The relative strength is a measurement of the ROI ranking of a stock compared to other stocks. The volume momentum measures trading volume of a stock compared to its own average volume from the recent 3-month period. Both the "Average Volume" and "Momentum" numbers are adjusted to the portion of the current intraday trading period automatically. They are also normalized to the high volume movements at market open and before market close.
Version 3.1+ have Company fundamental data added. Company fundamental data include Market capitalization, outstanding shares, EBITDA, PEG Ratio, Dividend per share, forward and trailing dividend rate and yield, dividend payout date, ex div date, P/E, trailing and forward PE, price/sales, short ratio, book value, price/book, price target, current and forward EPS, EPS report date, EPS ttm, Basic EPA, Diluted EPS, High/Low EPS estimation, number of analysts.
Updated on
Safety starts with understanding how developers collect and share your data. Data privacy and security practices may vary based on your use, region, and age. The developer provided this information and may update it over time.

No data shared with third parties
Learn more about how developers declare sharing

No data collected
Learn more about how developers declare collection
What's new
Includes “Average Volume Now” for showing intraday volume average at any specific instance of a market session.
Shows popup box showing detail numbers when the summary line (the top-level index or sector) is tapped.
Shows popup box showing detail numbers when the summary line (the top-level index or sector) is tapped.


