


Stock market performance and Index analysis
Indices Heatwave Stock market index tool analysis and meter
Indices Heatwave Stock market Index trading tools is a financial markets app and AI analysis tool that focuses on the traders tools and parameters that are important for trading as much as the basic movement of the Indices Instruments itself. These complex parameters are simplified in a graphical format and heat map to help traders in split decision making on buying or selling Indexes.
The Indexes performance meter app has 5 screens covering 4 important aspects of trading that is Indexes performance, Strength, Range, Volume and Volatility.
Home Screen
This screen projects the performances meter in an innovative fashion. The live cylindrical tubes movements projects best index performer live at the given time in one glance.
Strength Screen
The Indexes strength indicator screen of Indices Heatwave app shows the strength and weakness of the Indices in meter format.
Range screen
This screen shows the current price in comparison to 1 year high and 1 year low. It also shows the bull power and the bear power of the particular index.
Volume Screen
This screen projects the highest to lowest volume timeframe wise of the Indexes in cylindrical volume format. The highest and lowest volume denotes the maximum and least contracts traded for the Indexes at a particular moment. The green arrow denotes the highest volume from the lot and red arrow denotes the least volume from the lot.
Volatility Screen
This screen of Indexes heatwave app projects the highest and lowest volatility of the Indexes in the Yo-Yo format. The highest and lowest volatility denotes the maximum and least volatility movements for the Indexes at a particular moment.The green arrow denotes the highest volume from the lot and red arrow denotes the least volume from the lot. Use Indexes stock market tools wisely for maximum gains.
Take advantage of this smart Indexes trading stock market tool. Download Indices Heatwave: Stock market indexes tools and analysis meter for FREE!

Currency Exchange Forex trading Strength MeterCurrency Heatwave forex trading tools is a...

The NASDAQ-100 is an index which includes 100 of the world's largest...
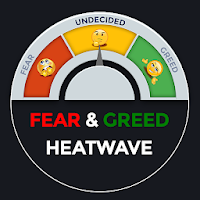
Fear and Greed relates to the volatility in the financial markets. This...

Volume pit FX is a great forex tool for measuring tick volume...
Why we are the life changing real time forex app?Real time Forex...


Created with AppPage.net
Similar Apps - visible in preview.